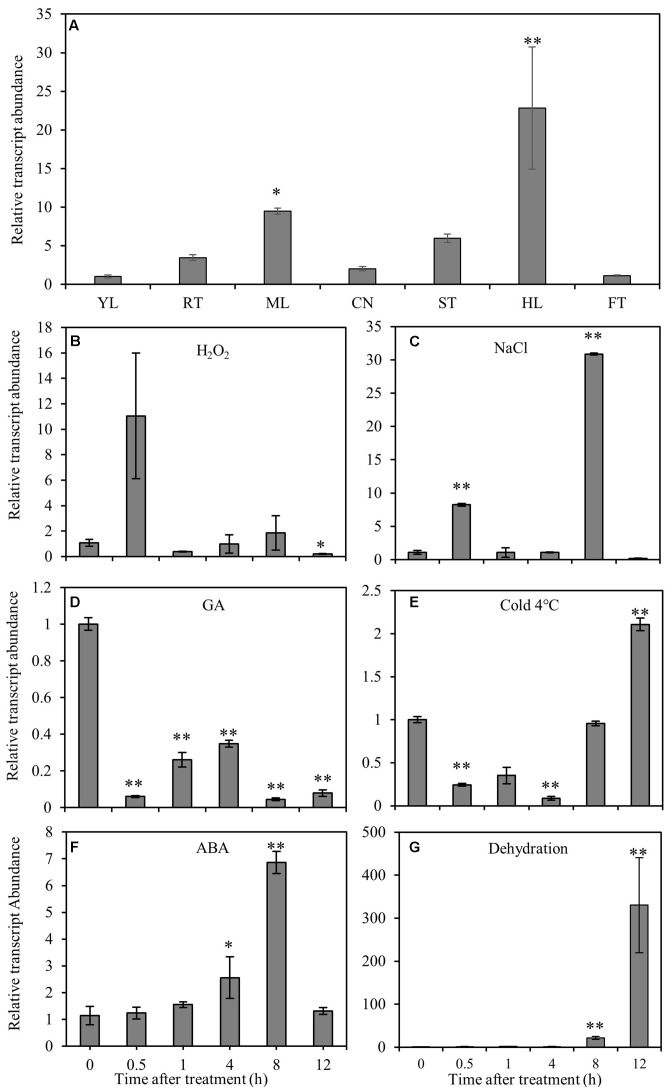
FIGURE 1.
Expression patterns of CmNAC1 in pumpkin seedlings under different stress treatments or in different organs. (A) Expression patterns of CmNAC1 in various organs (root, RT; young leaves, YL; mature leaves, ML; cotyledon, CN; hypocotyl, HL; stem, ST; fruit, FT). Expression patterns of CmNAC1 in leaves after H2O2 (B), NaCl (C), GA (D), cold (E), ABA (F) and dehydration (G) treatments by qRT-PCR analysis. Zero represents leaf sample without any treatment; 0.5, 1, 4, 8, and 12 represent samples after 0.5, 1, 4, 8, and 12 h treatment, respectively. The 2-ΔΔCT method was used in qRT-PCR analysis. Transcript levels were normalized to CmEF1α and CmCAC. Values are means ± SD of three replicates. Three independent experiments were performed. Asterisks indicate a significant difference (∗P < 0.05; ∗∗P < 0.01) compared with the corresponding controls.

