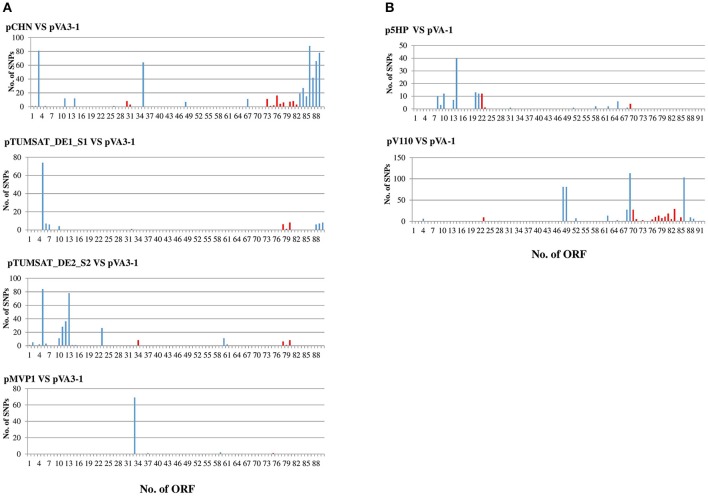
Figure 2.
Pair-wise SNP comparison of isolates from the same plasmid cluster. pVA3-1 and pVA-1 were used as reference genome for pMVP1, pCHN, pTUMSAT_DE1_S1, and pTUMSAT_DE2_S2 (A), and p5HP and pV110 (B) respectively. Blue bar indicates the SNP position in non-core genes of pVA-1 or pVA3-1, while red bar indicates the SNP position in the core genome of the plasmids. X-axial indicates the order of open reading frame (ORF) in pVA3-1 or pVA-1 genome.

