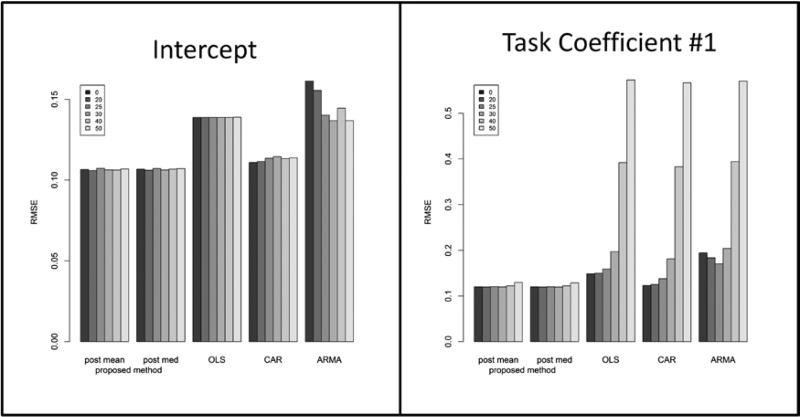
Figure 3.
Root mean square error for simulation experiment Simulation, described in detail in the Supplement, assumed five separate tasks. Shading represents detection limit used in simulation (higher detection limit corresponds to larger proportion of missing data). Coefficient from task #1 (based on Receiving Powder task from nanoparticle data set described in Supplement) displayed the largest bias resulting from missing data. Results from other tasks are shown in Supplementary Figure S8.

