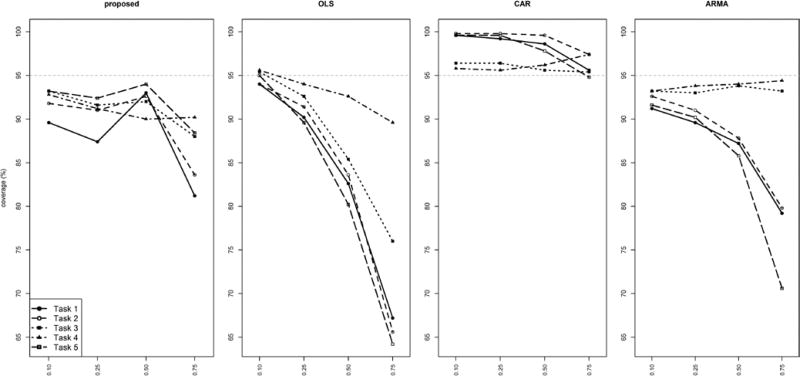
Figure 4.
Interval coverage for simulation experiment with AR(1) errors Y-axis shows coverage probabilities for our method (‘proposed’) compared with three commonly used frequentist methods. X-axis shows assumed autoregressive parameter. Individual line styles show five distinct tasks, described in detail in the Supplement.

