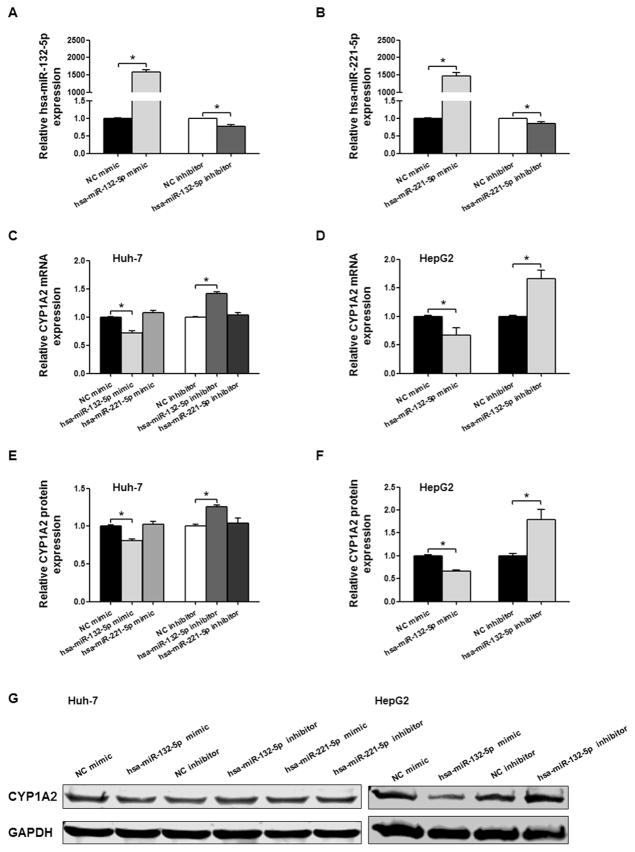
Fig. 4.
Detection of hsa-miR-132-5p and hsa-miR-221-5p regulatory effects on CYP1A2 expression in Huh-7 cells and HepG2 cells. Relative hsa-miR-132-5p (A) and hsa-miR-221-5p expression (B) in Huh-7 cells transfected with microRNA mimics or inhibitors. U6 was used as a loading control. (C) Relative CYP1A2 mRNA expression in Huh-7 cells when transfected with hsa-miR-132-5p or hsa-miR-221-5p mimics or inhibitors, and GAPDH mRNA expression was used as an internal control. (D) Relative CYP1A2 mRNA expression in HepG2 cells when transfected with hsa-miR-132-5p mimics or inhibitors, and GAPDH mRNA expression was used as an internal control. (E) Densitometry analysis shows the protein expression of CYP1A2 in Huh-7 cells transfected with hsa-miR-132-5p or hsa-miR-221-5p mimics or inhibitors, and GAPDH was used as loading control. (F) Densitometry analysis shows the protein expression of CYP1A2 in HepG2 cells transfected with hsa-miR-132-5p mimics or inhibitors, and GAPDH was used as loading control. (G) Representative Western blot analysis shows the protein expression of CYP1A2 in Huh-7 cells and HepG2 cells transfected with hsa-miR-132-5p or hsa-miR-221-5p mimics or inhibitors. The bar graph represents the densitometry analysis of CYP1A2 expression from five independent experiments and intensities of bands were normalized to the amount of GAPDH. All values are represented as the mean ± SEM from five independent experiments, * P < 0.05 versus NC mimic or NC inhibitor respectively.

