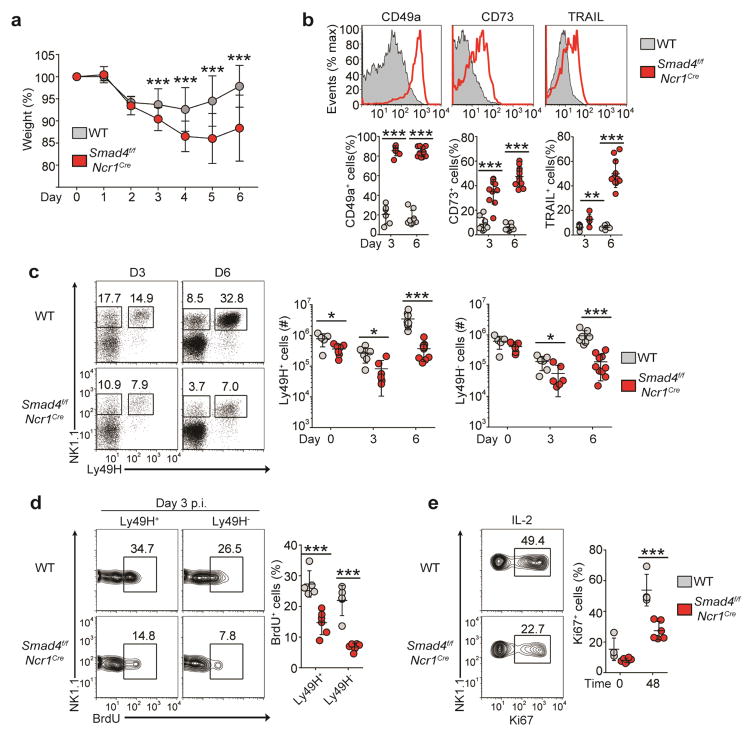
Figure 4.
SMAD4 is necessary for the anti-viral function of NK cells. (a) Weight of Smad4f/f and Smad4f/fNcr1iCre mice at various times (horizontal axis) after infection with MCMV (5 × 10⁴ plaque-forming units), presented relative to weight before infection. (b) Flow cytometry (top) and quantification (bottom) of the ex vivo surface expression of ILC1 markers on splenic NK cells from mice as in a at day 6 (top) or day 3 or 6 (bottom) after infection with MCMV. (c) Flow cytometry of splenic NK cells (gated on CD3−CD19−) from mice as in a at day 3 or 6 after infection with MCMV (left), and absolute number of Ly49H+ (middle) and Ly49H− (right) splenic NK cells. Numbers adjacent to outlined areas indicate percent NK1.1+Ly49H− cells (left) or NK1.1+Ly49H+ cells (right). (d) Flow cytometry of the incorporation of BrdU by Ly49H+ or Ly49H− splenic NK cells from mice as in a at day 3 after infection with MCMV (left), and quantification of BrdU+ Ly49H+ or Ly49H− cells (right). Numbers adjacent to outlined areas (left) indicate percent NK1.1+BrdU+ (proliferating) cells. (e) Flow cytometry (left) and quantification (right) of Ki67 expression by splenic NK cells from uninfected mice assessed after 48 h of culture with IL-2 (48) or immediately after isolation without further culture (0). Numbers adjacent to outlined areas (left) indicate percent NK1.1+Ki67+ (proliferating) cells. Each symbol (b–e) represents an individual mouse; small horizontal lines indicate the mean (± s.d.). *P < 0.05, **P < 0.01 and ***P < 0.001 (unpaired Student’s t-test). Data are pooled from four (a–d; mean ± s.d. in a) or three (e) independent experiments with at least two mice per genotype per time point in each.

