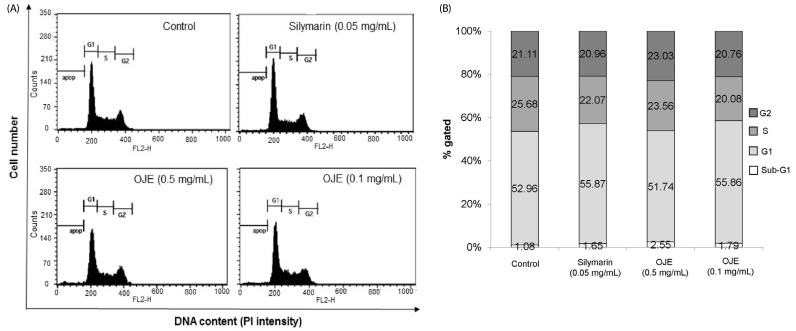
Fig. 2. Effect of OJE on the cell cycle in HSC-T6 cells.
DNA contents in different phases of the cell cycle were measured by flow cytometry using propidium iodide. The cell cycle distribution for each treatment group and the percentage of the cell cycle distribution are represented by graphs (A) and histogram (B), respectively. OJE: O. japonica extract.

