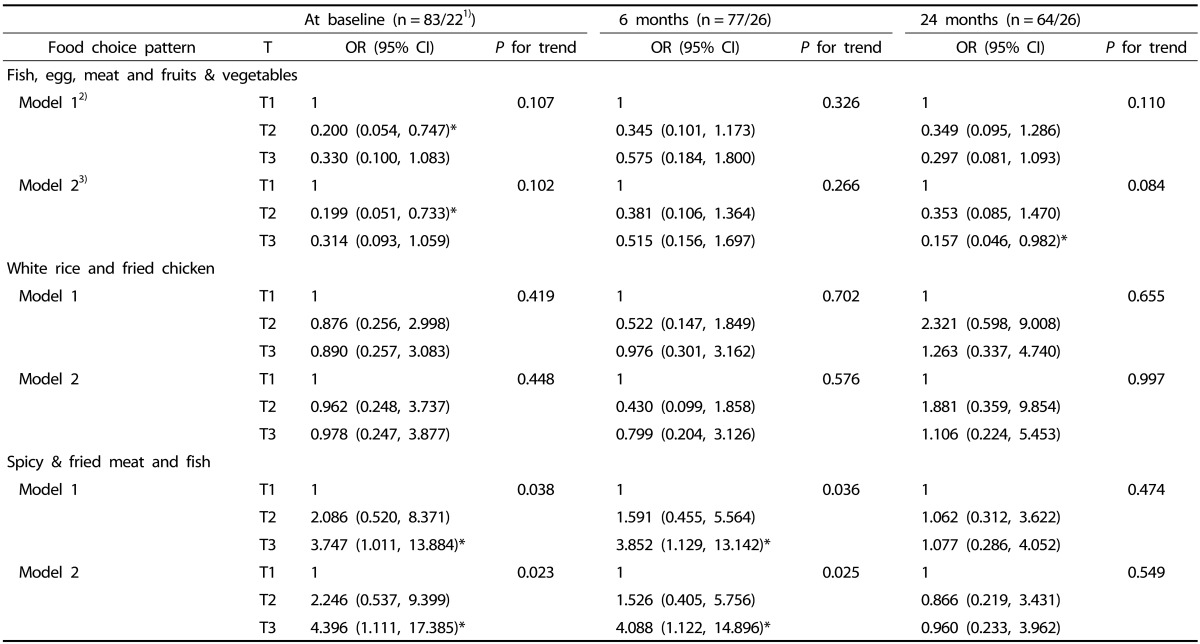
Table 3. Odds ratios (95% CI) for overweight risk according to the tertiles (T) of dietary pattern scores at baselines and follow-ups.
OR, odds ratio; CI, confidence interval; T, tertile.
1)n = total patients/overweight patients
2)Model 1 adjusted for age (years, continuous).
3)Model 2 adjusted for age (years, continuous), gender (men, women), diagnostic categories (acute lymphoblastic leukemia, peripheral blood stem cell transplantation, and others), and duration of disease (day, continuous).
*P < 0.05

