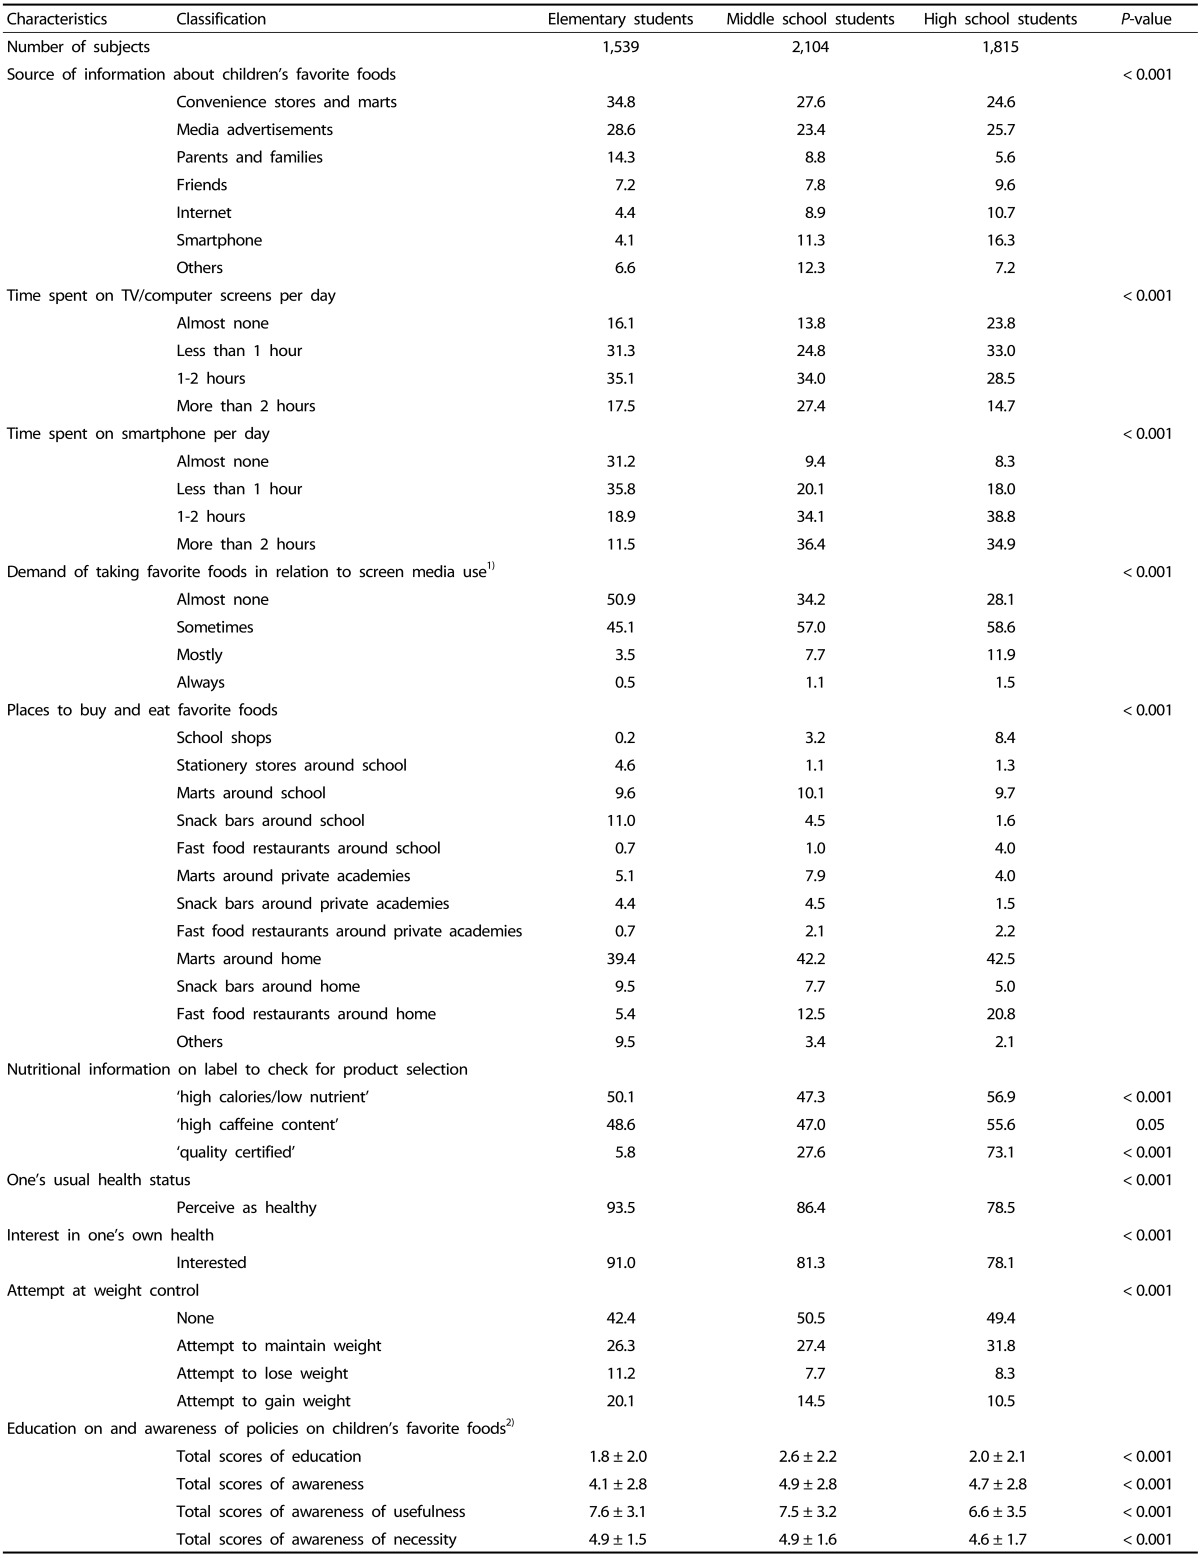
Table 2. Comparison of the factors related to children's favorite food intake among elementary, middle, and high school students.
Values are shown as a percentage or mean ± standard deviation.
Statistical significance was obtained using the Chi-square test or analysis of variance test.
1)Includes use of TV or computer screens and a smartphone
2)Total scores were calculated using the arithmetic sum of the individual scores. The score ranges are 0-6 for education, 0-10 for awareness, 0-10 for awareness of usefulness, and 0-10 for awareness of necessity.

