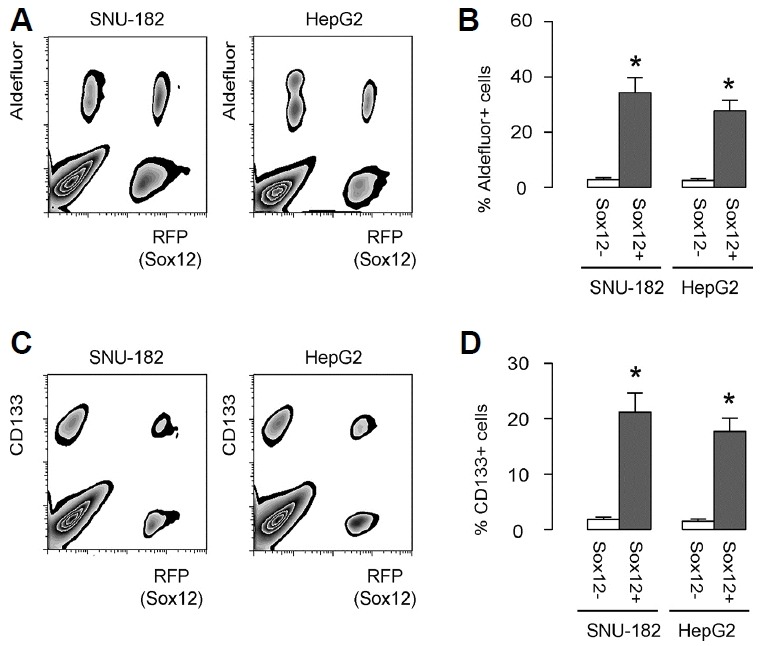
Fig. 2. CSC marker expression in Sox12+ versus Sox12-HCC cells.

(A, B) The different fractions of HCC cells (GFP+RFP+ cells that represent Sox12+ cells and GFP+RFP− cells that represent Sox12− cells) were subjected to flow cytometry analysis for Aldefluor. The ratio of Aldefluor+ versus Aldefluor− cells were quantified in both GFP+RFP+ HCC cell fraction and GFP+RFP− HCC cell fraction, shown by representative flow chart (A), and by quantification (B). (C–D) The fluorescent HCC cells (GFP+RFP+ HCC cells and GFP+RFP− HCC cells) were subjected to flow cytometry analysis for CD133. The ratio of CD133+ versus CD133− cells were quantified in both GFP+RFP+ HCC cell fraction and GFP+RFP− HCC cell fraction, shown by representative flow chart (C), and by quantification (D). *p < 0.05. N = 5.
