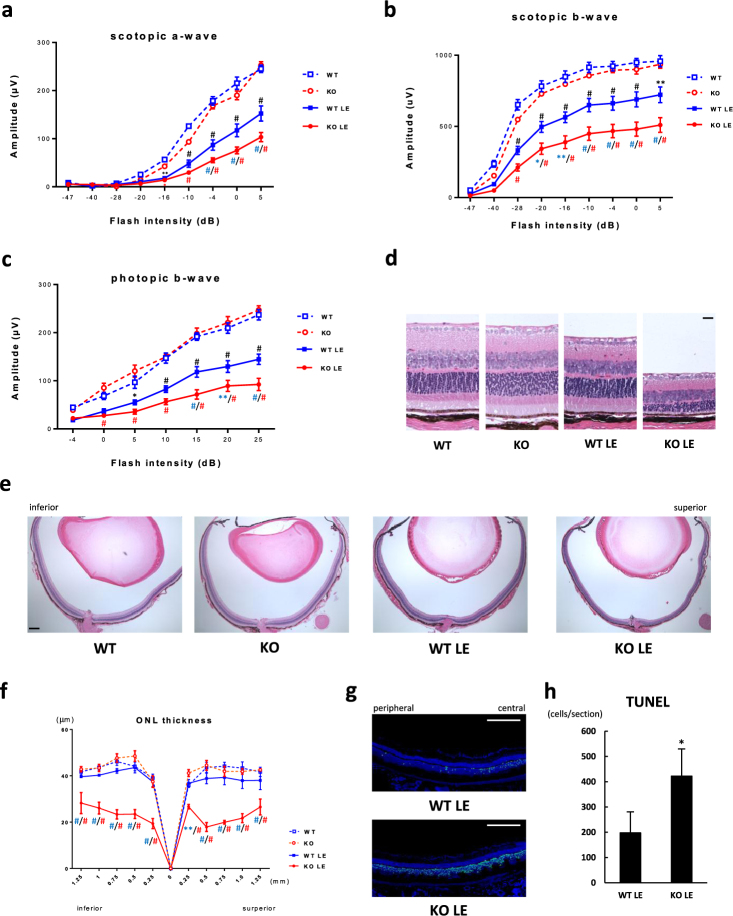
Fig. 4.
SIRT3 KO retinas showed decreased retinal function and outer nuclear layer (ONL) thinning after the light exposure (LE). a–c Electroretinogram (ERG) of WT and SIRT3 KO retinas with 129 background without and with LE (4 days after LE; WT (blue square with dashed line): n = 4, KO (red circle with dashed line): n = 4, WT LE (blue square with solid line): n = 8, KO LE (red circle with solid line): n = 10) a Scotopic a-wave amplitude of WT and SIRT3 KO retinas with 129 background without and with LE. b Scotopic b-wave amplitude of WT and SIRT3 KO retinas with 129 background without and with LE. c Photonic b-wave amplitude of WT and SIRT3 KO retinas with 129 background without and with LE. *p < 0.05, **p < 0.01, and #p < 0.001 by two-way ANOVA with post hoc Tukey’s HSD test (black: WT vs WT LE, blue: WT LE vs KO LE, red: KO vs KO LE). d, e Representative HE staining images of WT and SIRT3 KO retinas with 129 background without and with LE (7 days after LE). Scale bars: d 20 μm e 200 μm. f Outer nuclear layer (ONL) thickness of WT and SIRT3 KO retinas with 129 background without and with LE (7 days after LE; WT (blue square with dashed line): n = 4, KO (red circle with dashed line): n = 4, WT LE (blue square with solid line): n = 4, KO LE (red circle with solid line): n = 5). *p < 0.05, **p < 0.01, and #p < 0.001 by two-way ANOVA with post hoc Tukey’s HSD test (blue: WT LE vs KO LE, red: KO vs KO LE). g Representative images of terminal deoxynucleotidyl transferase dUTP nick end labeling (TUNEL) stain for WT and SIRT3 KO retinas with 129 background 36 h after LE. Blue: DAPI, Green: TUNEL. Scale bars: 250 μm. h Comparison of TUNEL-positive cell counts per section (n = 6 for WT LE and n = 4 for KO LE). *p < 0.05 by two-tailed unpaired t-test. Values are mean ± SE for ERG analysis, and mean ± SD for ONL thickness and TUNEL analysis, respectively

