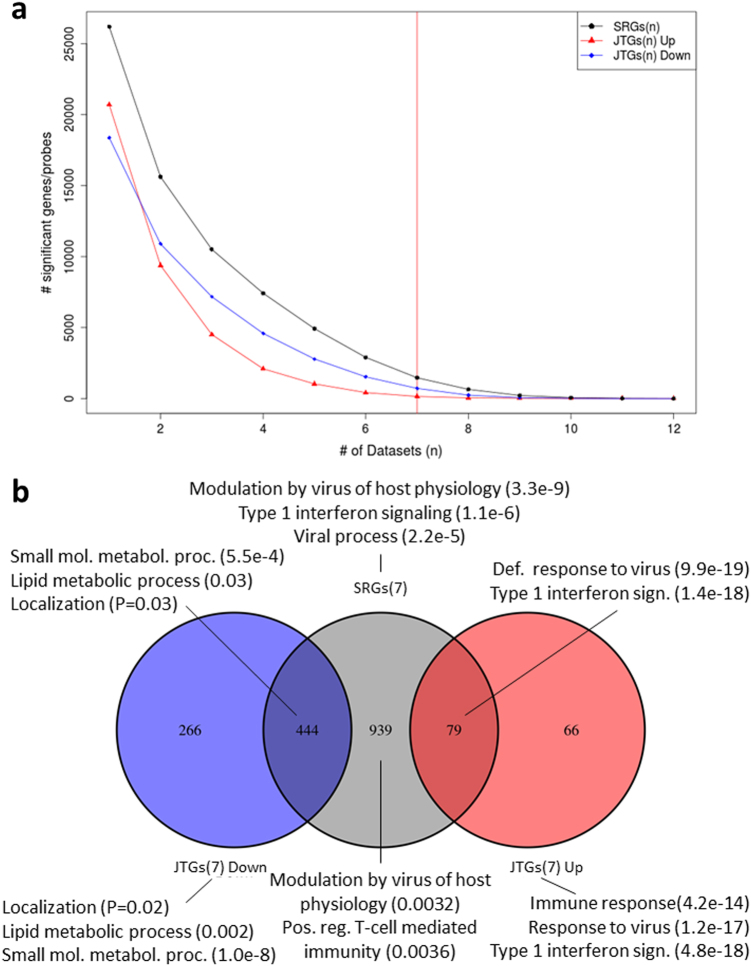
Fig. 2.
Conservation of the differentially expressed gene sets including ANOVA-based SRGs and Jonckheere trend analysis-based JTGs, across multiple data sets. SRGs(n) and JTGs(n) refer to the SRGs and JTGs shared by n data sets (n = 1, 2, …, n), respectively. a The number of SRGs(n) (black line), the number of up-regulated JTGs(n) (red line), and the number of down-regulated JTGs(n) (blue line). b A Venn diagram of the overlap between SRGs(7), and the up-regulated and down-regulated JTGs(7). Biological functions refer to the pathways enriched in the corresponding sets and the numbers in parentheses indicate the corrected FET p-values

