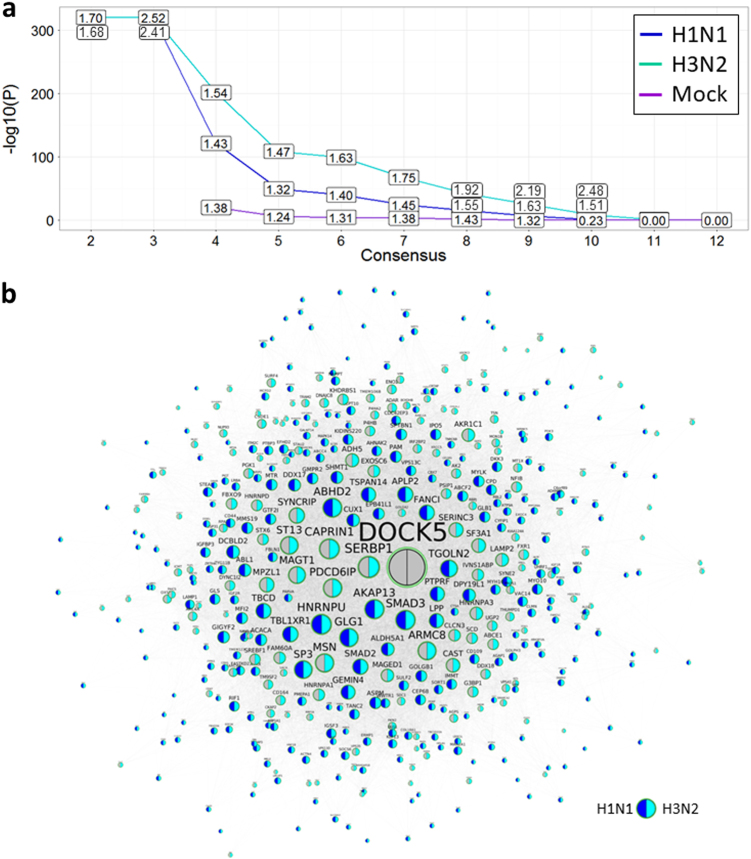
Fig. 6.
Validation of DOCK5 centered gene co-expression networks (DOCK5-CCGS) by the gene signatures (sgDOCK5-DEGS) identified from the DOCK5 knockout experiments. a The enrichment of the DOCK5 centered network for the differentially expressed gene sets induced by the knockout of DOCK5 under H1N1, H3N2, and MOCK infections. The x-axis shows the DOCK5-centered co-expression network DOCK5-CCGS(n) conserved in at least n data sets, n = 2,3,…,12. The y-axis indicates the—log10 of corrected FET p-values. Boxed labels show corresponding fold-changes. b A subnetwork of DOCK5-CCGS(7), i.e., the genes correlated with DOCK5 in at least 7 data sets shows the genes shared by DOCK5-CCGS(7), DOCK5’s knockout signature (sgDOCK5-DEG+) and the union of the consensus differential expression gene signature SRGs(7) and the consensus down-regulated gene signature JTGsdown(7). The selected nodes are up-regulated by DOCK5 in either the H1N1 or H3N2 infection. The left and right color sectors in each node indicate whether it was differentially expressed in H1N1 infection (blue for significant differential expression and grey for non-significant one) and H3N2 infection (cyan for significant differential expression and grey for non-significant one), respectively

