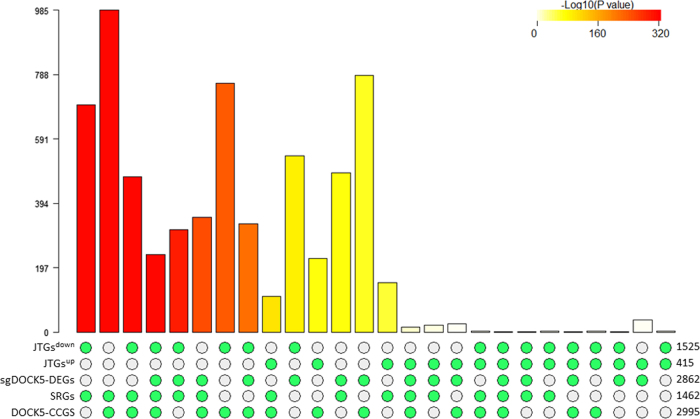
Fig. 7.
Intersections amongst DOCK5-CCGS(7), SRGs(7), JTGsup(7), JTGsdown(7) and sgDOCK5-DEG+ by Super Exact Test. The bar chart plot shows the combinations of the five gene sets with non-empty intersections. The matrix of solid and empty circles at the bottom illustrates the “presence” (solid green) or “absence” (empty) of the gene sets in each intersection. The numbers to the right of the matrix are set sizes. The colored bars on the top of the matrix represent the intersection sizes with the color intensity showing the p-value significance. The intersections are ordered by p-values of the super exact test

