
Figure 2.
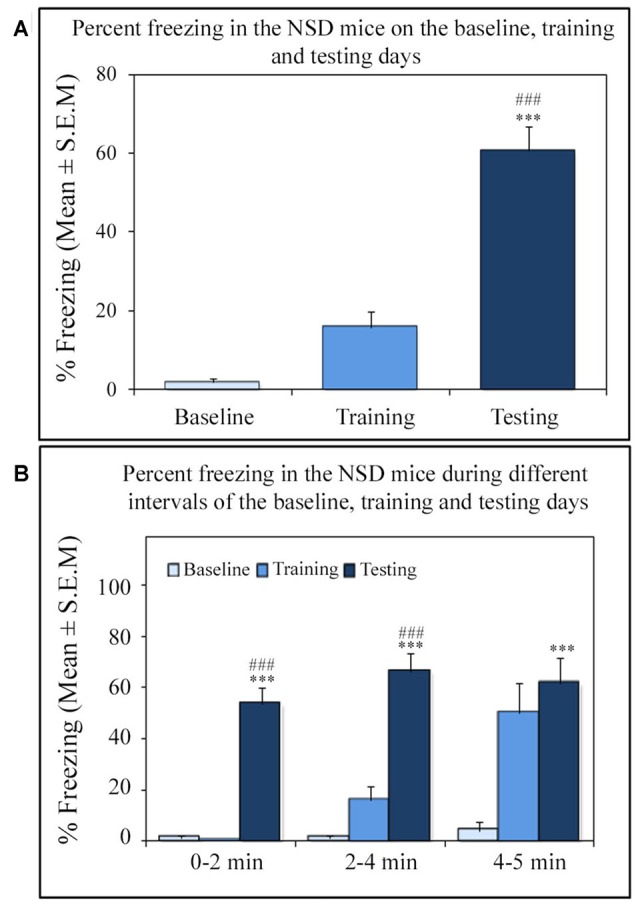
The percent freezing response in Non-SD (NSD) animals on the baseline, training and testing days. (A) The NSD mice exhibited a significant increase in percent freezing (p < 0.001; F(2,23) = 60.64) on the testing day (compared to baseline day: Tukey p < 0.001; compared to training day: Tukey p < 0.001). (B) The percent freezing significantly increased on the testing day during the 0–2 min (compared to baseline day: Tukey p < 0.001; compared to training day: Tukey p < 0.001), 2–4 min (compared to baseline day: Tukey p < 0.001; compared to training day: Tukey p < 0.001), and 4–5 min (compared to baseline day: Tukey p < 0.001) time periods (the corresponding times of pre-shock, shock and post-shock periods of the training day). ***p < 0.001 (compared to baseline day); ###p < 0.001 (compared to training day).