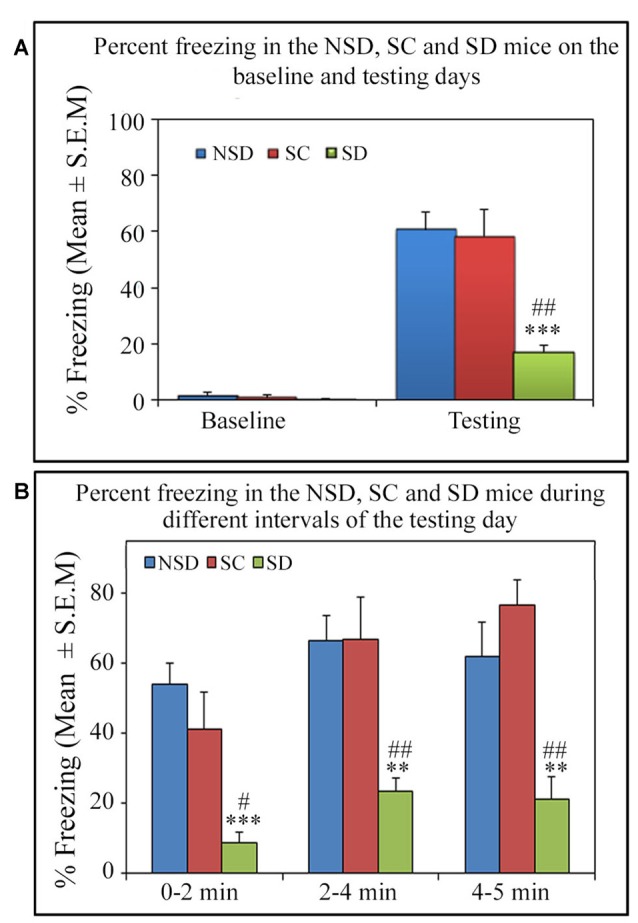
Figure 5.

The comparative changes in percent freezing response in the NSD, SC and SD animals. (A) The NSD, SC and SD animals showed a comparable freezing response on the baseline day. The percent freezing in the SD animals was significantly less (p < 0.001, F(2,18) = 13.82) compared to the NSD (Tukey p < 0.001) and SC (Tukey p < 0.01) animals. (B) In the SD animals, the precent freezing was significantly less on the testing day during the 0–2 min (compared to NSD group: Tukey p < 0.001; compared to SC group: Tukey p < 0.05), 2–4 min (compared to NSD group: Tukey p < 0.01; compared to SC group: Tukey p < 0.01) and 4–5 min (compared to NSD group: Tukey p < 0.01; compared to SC group: Tukey p < 0.01) time periods (the corresponding times of pre-shock, shock and post-shock periods of the training day). **p < 0.01 and ***p < 0.001 (compared to NSD group); #p < 0.05 and ##p < 0.01 (compared to SC group).
