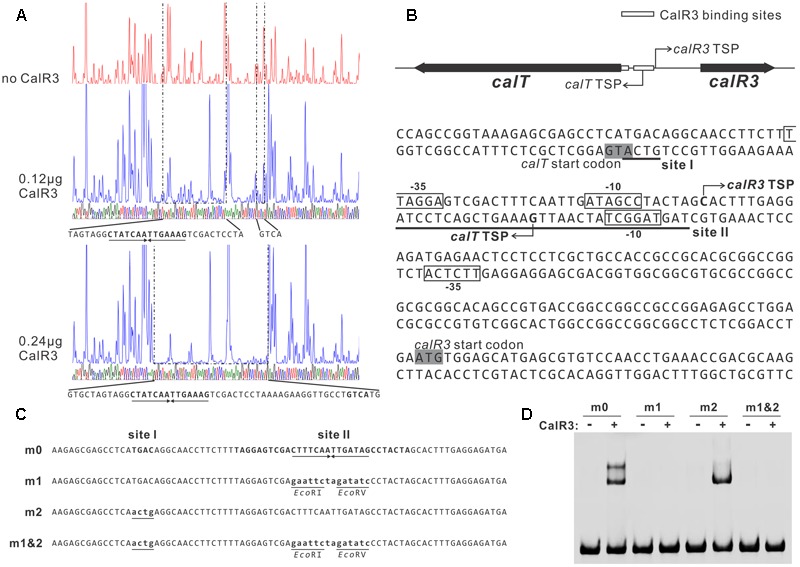
FIGURE 5.

Determination of the binding sites of CalR3 protein. (A) DNase I footprinting assay of CalR3 on the T-R3L region. The fluorograms correspond to the control reaction without CalR3 protein and to the protection patterns with increasing CalR3 protein (0.12 and 0.24 μg). (B) Nucleotide sequences of the T-R3L promoter region and CalR3-binding site. Solid line, CalR3-binding site; shaded areas, translational start codons; bent arrow, TSPs; boxes, putative –10 and –35 regions. (C) Mutations introduced into the CalR3 binding sites I and II regions. Each probe was 80 bp. Probe m0 was WT DNA containing a 14 bp palindromic sequence in site II. Base substitutions were introduced into probe m0 to produce mutated probes m1, m2, and m1&2, respectively. Altered nucleotides are underlined. (D) EMSAs with WT DNA probe and mutated probes. Each reaction mixture contained 1.5 μM probe and 0.8 μM of purified His6-CalR3 protein.
