
Figure 1.
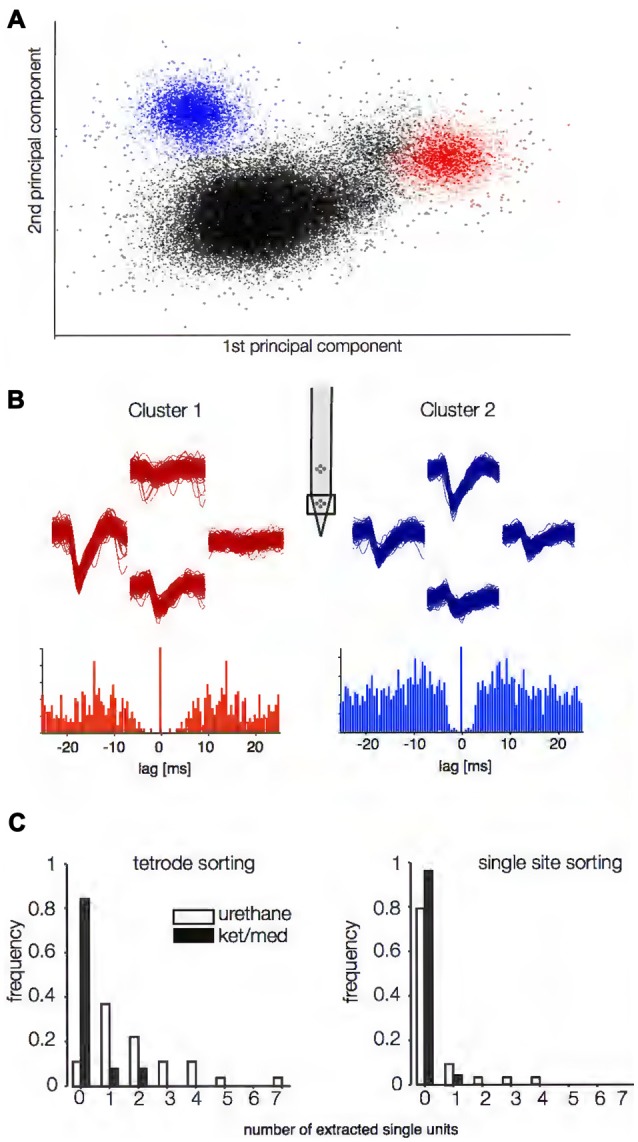
Spike-sorting success under two different anesthetics. Putative single units were judged to be successfully extracted using criteria based on separability of waveforms in principal component space (A) and the shape of the inter-spike interval (ISI) autocorrelation function (B). In (A) the first two principal components of the spike snippets are plotted for an example recording obtained under urethane anesthesia. In this example, two single units could be successfully extracted (blue and red dots, respectively). In (B), the autocorrelation functions for the ISIs for the two units are displayed. The traces above the autocorrelation panels show voltage traces at the different sites of the tetrodes (inset) for both units. (C) Spike-sorting success for all recording sites obtained under ketamine/medetomidine (ket/med, n = 52) and urethane (n = 27) anesthesia. The left panels depict sorting success if all four sites of the tetrode (B, upper panels) were used (p = 2.8*10−10, Wilcoxon rank-sum test). For the right panel, the same data was analyzed, but using only one site per tetrode for spike sorting (p = 0.0094, Wilcoxon rank-sum test).