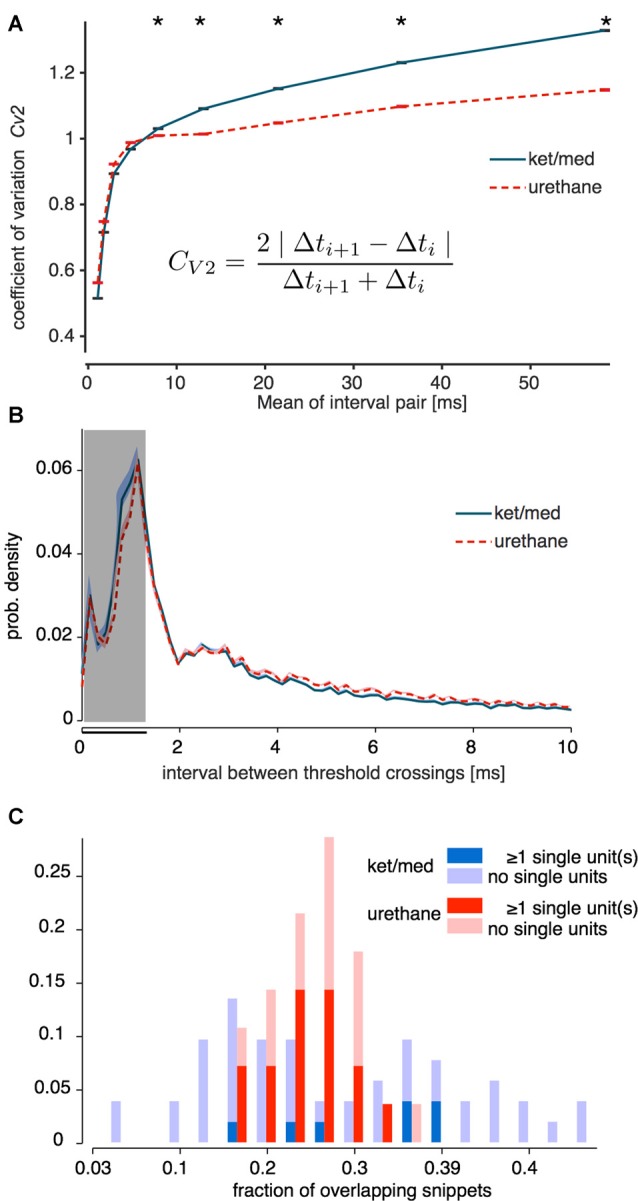
Figure 2.

Overlap of spike snippets. In (A), the CV2 (see inset) is plotted as measure of the irregularity (“burstiness”) of the inter-event intervals (IEIs) of the snippets used for sorting under ketamine/medetomidine (ket/med, blue line) and urethane (dotted red line) anesthesia. Error bars depict standard error of the mean (SEM) on the vertical axis; SEM is in the range of the thickness of horizontal cap lines. Asterisks mark data points for which the CV2 under ketamine is significantly larger than under urethane (one-sided Wilcoxon rank-sum test, p < 0.001). (B) Mean IEI distribution for all recordings of the unsorted events (blue/red shaded areas: SEM). The gray area indicates the criterion for minimal IEIs used to classify sorting of a unit as successful (Figure 1B). In (C) the distribution of the fraction of overlapping snippets for urethane (red) and ket/med (blue) is displayed. Successful and unsuccessful sorts are plotted separately in different dark and light shades, respectively (Kolmogorov-Smirnov test for difference in distributions: ket/med, p = 0.15, urethane, p = 0.30).
