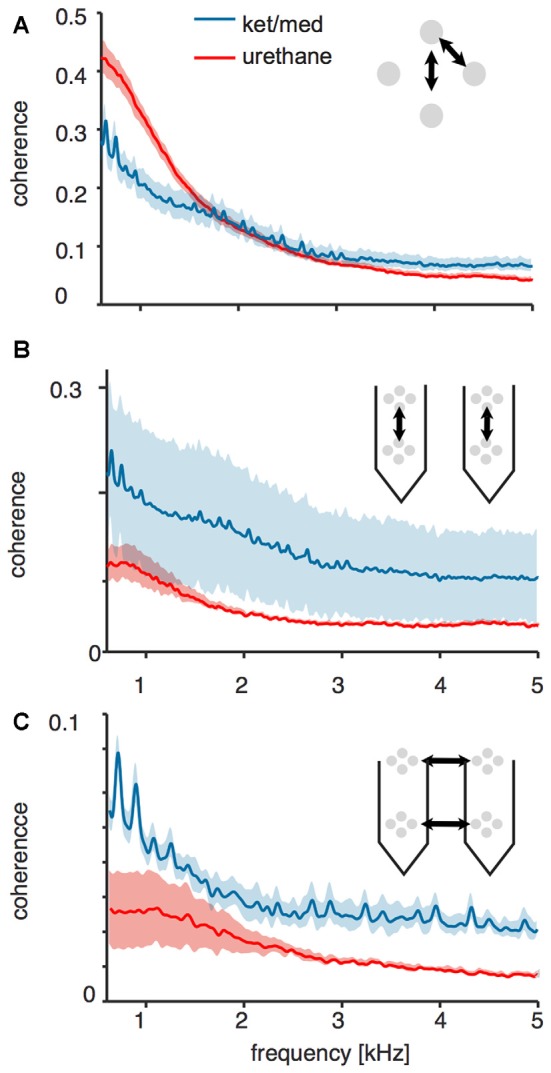
Figure 4.

Coherence of raw voltage traces across different sites of the probes. All panels show mean ± SEM coherence of voltages across different geometries of electrode site pairs for recordings obtained under ketamine/medetomidine (blue) or urethane (red) anesthesia. (A) Local electrode sites within the same tetrode. (B) Distant electrode sites across tetrodes along the same shank of the recording probe. (C) Distant electrode sites across tetrodes on different shanks.
