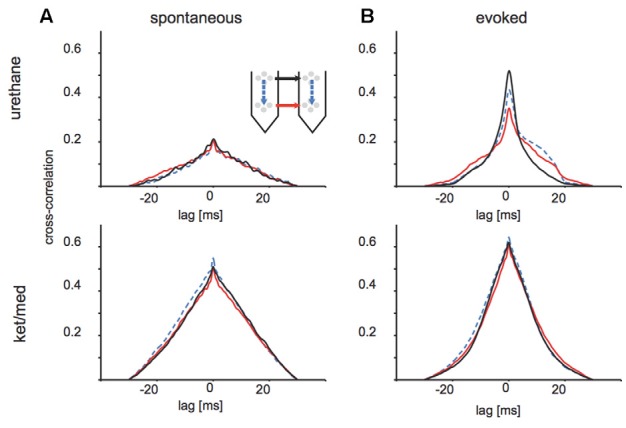
Figure 5.

Cross-correlation of multi-unit activity across different sites of the probes. (A) Cross-correlations of spontaneously appearing events (multi-unit activity) under urethane (upper panel) and ketamine/medetomidine (lower panel) anesthesia. Line styles indicate geometry of the depicted pairwise comparision. Black: across shanks, superficial tetrodes; red: across shanks, deeper tetrodes; blue dotted: within shank, across tetrodes. (B) Same quantification as (A) but for evoked activity within a 50 ms window of sound onset.
