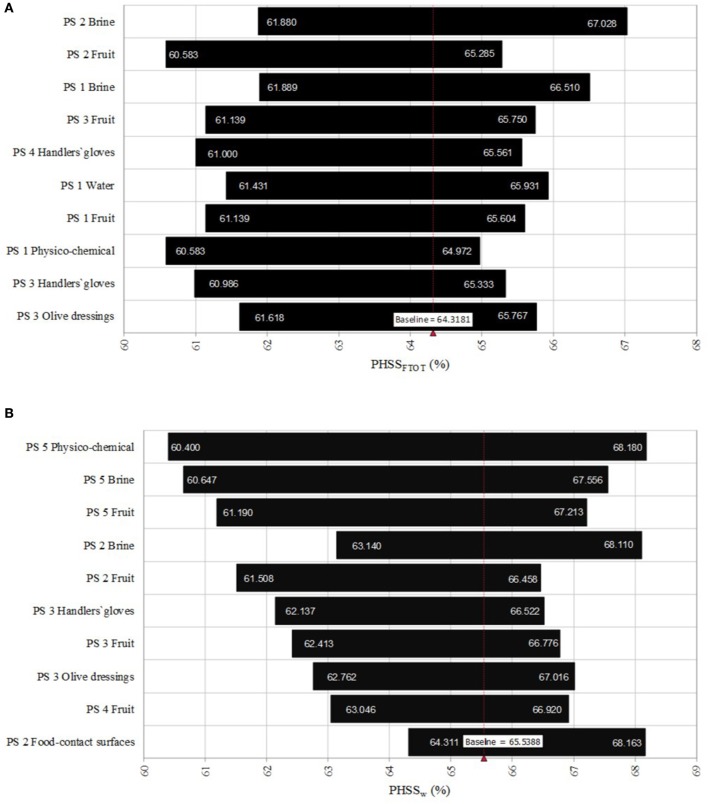
Figure 5.
Results of the sensitivity analysis describing the relative influence of the type of sample on the variation of the mean value for the global Performance Hygiene and Safety Score (PHSSFTOT) (A) and the weighted Performance Hygiene and Safety Score (PHSSw) (B). PS stands for the processing step.

