Figure 1.
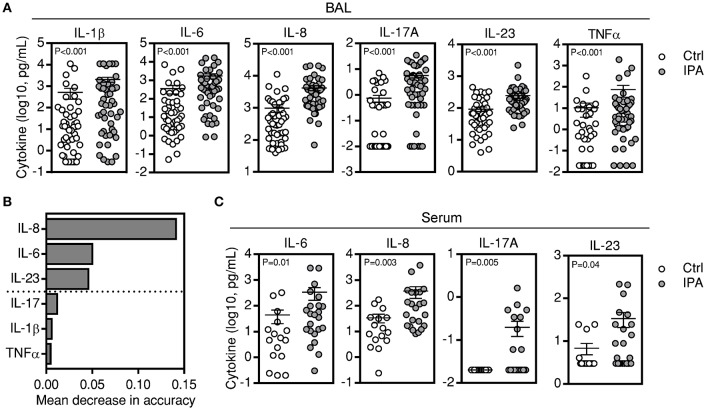
A subset of BAL cytokines is differentially expressed in IPA. (A) Levels of cytokines present in the BAL of patients with IPA compared with controls (Ctrl). Data are presented as mean ± SEM values. (B) Ranking of cytokines by their relative importance in discriminating cases of IPA from controls using RFA. The horizontal axis represents the average decrease in classification accuracy, and bars indicate the relative importance of each individual cytokine to discrimination. The dashed line divides cytokines at the mean value of decrease in accuracy and defines the number of cytokines required for maximum classification accuracy. (C) Levels of cytokines present in the sera of patients with IPA compared with controls (Ctrl). Data are presented as mean ± SEM values.

