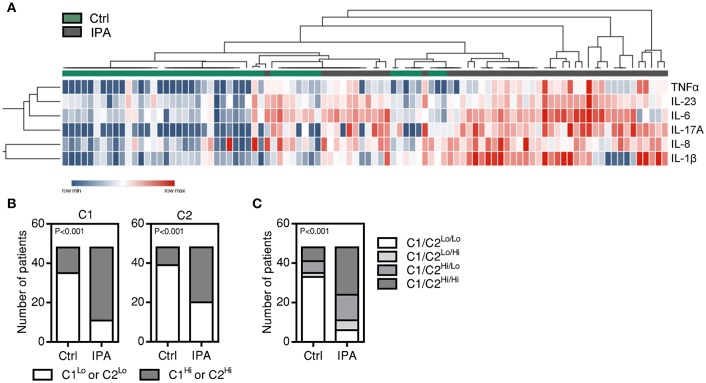
Figure 2.
Cluster analysis reveals two groups of highly expressed BAL cytokines in IPA. (A) Unsupervised hierarchical clustering for IL-1β, IL-6, IL-8, IL-17A, IL-23, and TNFα. Expression levels of individual cytokines are represented by shades of blue to red in the heatmap, with highest values in dark red and lowest values in dark blue. The top dendrogram illustrates the separate clustering of cases of IPA (indicated by gray boxes) from controls (Ctrl) (indicated by green boxes). The left dendrogram illustrates the identification of two cytokine clusters: C1 (TNFα, IL-23, IL-6, and IL-17A) and C2 (IL-8 and IL-1β). (B) Number of patients presenting low and high values of C1 (C1Lo and C1Hi, respectively) and C2 cytokines (C2Lo and C2Hi, respectively) among controls (Ctrl) and cases of IPA. (C) Number of patients with combined information on the levels of C1 and C2 cytokines among controls (Ctrl) and cases of IPA. Four categories are indicated: C1Lo/C2Lo, C1Lo/C2Hi, C1Hi/C2Lo, C1Hi/C2Hi.

