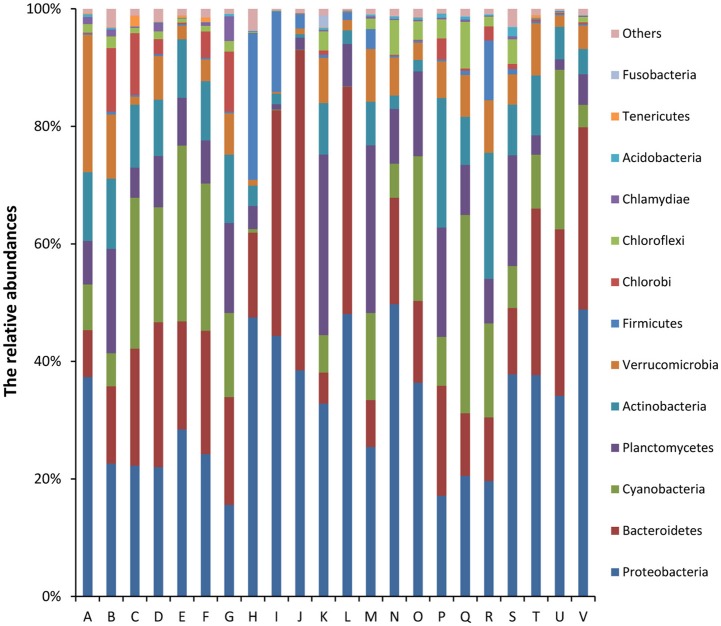
Figure 2.
Relative abundances (%) of dominant phyla from all samples based on 16S rRNA gene amplicon sequencing data. The phylum level distribution presented is based on 80% similarity cluster OTUs. Unclassified phyla with relative abundances lower than 1% were assigned as “others.” The 10 major dominant phyla included Proteobacteria, Bacteroidetes, Cyanobacteria, Planctomycetes, Actinobacteria, Verrucomicrobia, Firmicutes, Chlorobi, Chloroflexi, and Chlamydiae.

