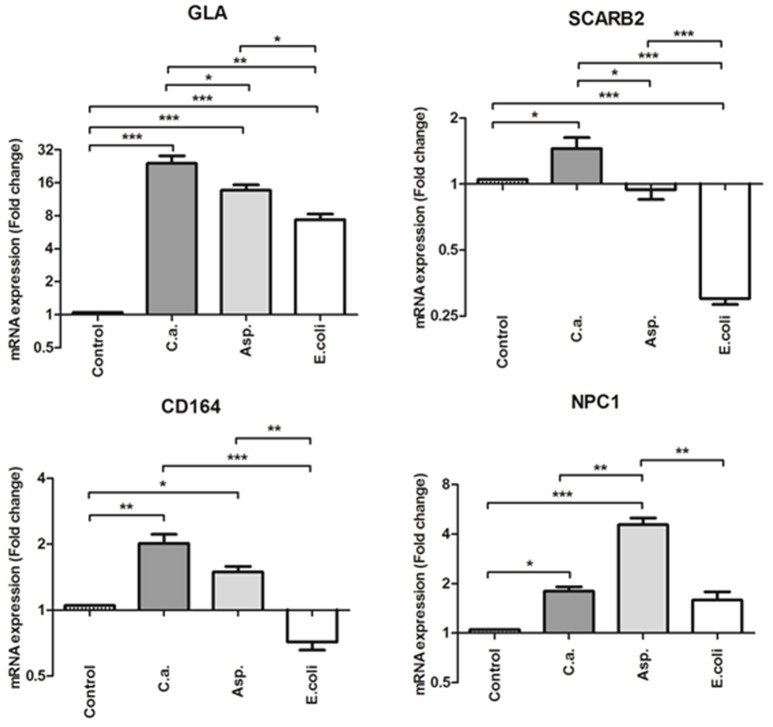
Figure 1.
Relative mRNA expression of GLA, SCARB2, CD164, and NPC1 after stimulation with Candida albicans (C.a.), Aspergillus fumigatus (Asp.) and Escherichia coli (E. coli). Data were obtained from four independent experiments, each performed with cells from different donors. Results are presented as mean ± SE of the fold change relative to the control (unstimulated cells) according to (Pfaffl et al., 2004). (Please see also: Rieu and Powers, 2009. Real-Time Quantitative RT-PCR: Design, Calculations, and Statistics. The Plant Cell; Vol. 21: 1031–1033. Shown is also the statistical significance after repeated measures One-Way ANOVA after multiple testing correction (Bonferroni) (***p < 0.001; **p < 0.01; *p < 0.05).

