
FIGURE 6.
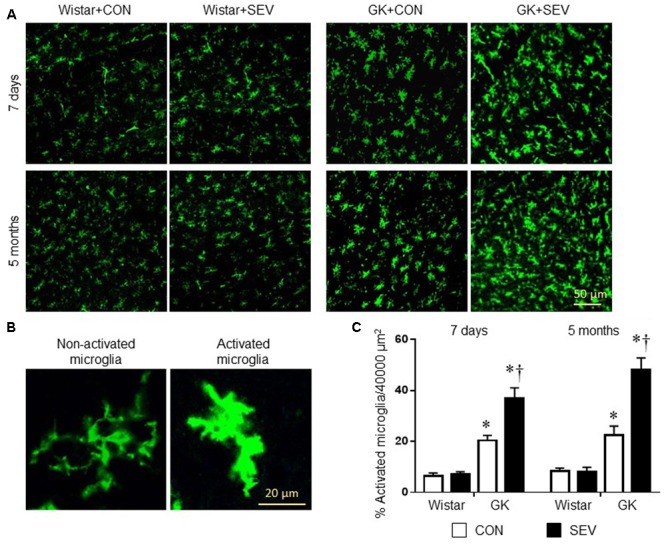
Microglia activation in the hippocampus in type 2 diabetic Goto–Kakizaki (GK) rats and non-diabetic Wistar rats 7 days and 5 months after sevoflurane (SEV) or sham (control, CON) exposure. (A) Representative photomicrographs showing CD11b-immunoreactive microglia in the hippocampus in each group. (B) Representative photomicrographs showing non-activated and activated microglia in the hippocampus. (C) Quantitative analysis of activated microglia in the hippocampus in each group. The number of activated microglia in the hippocampus was higher in GK + CON rats than that in Wistar + CON rats at both time points and was further increased in GK + SEV rats. Data are presented as mean ± SE (n = 4 for each group). ∗P < 0.05 vs. respective Wistar rats at the same time point; †P < 0.05 vs. GK + CON rats at the same time point.