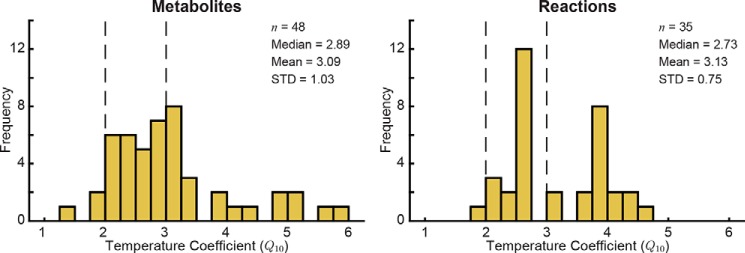
Figure 2.
Distribution of Q10 coefficients for metabolites and reactions. Q10 coefficients for metabolites were calculated based on the observed change in metabolite concentration across temperature. The vertical dashed lines at Q10 = 2 and Q10 = 3 represent the typical estimated range of Q10 coefficients for biological processes. STD, standard deviation.

