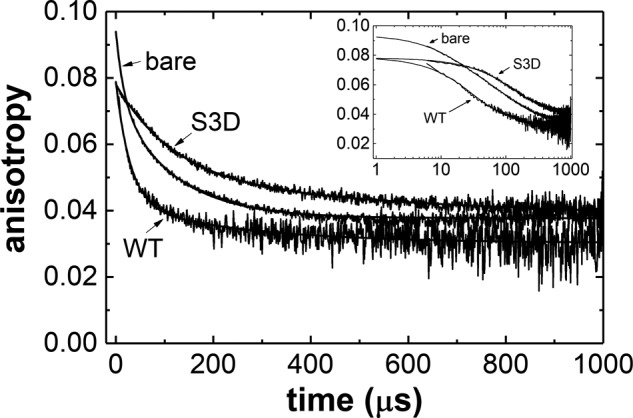
Figure 5.

S3D decoration weakly affects actin filament torsional dynamics. Shown are phosphorescence anisotropy decays for ErIA-labeled actin, WT-decorated (ν ∼0.9), and S3D-decorated (ν ∼0.9) fitted to a double exponential (smooth lines through data). Fit residuals are 1–2% of signal, and the fitting parameters are listed in Table 5. The inset shows data in log scale to reveal differences at early time scales. A model-dependent analysis (12) of the anisotropy decays was also performed to calculate the filament intersubunit torsional constant α and torsional rigidity C (Table 4).
