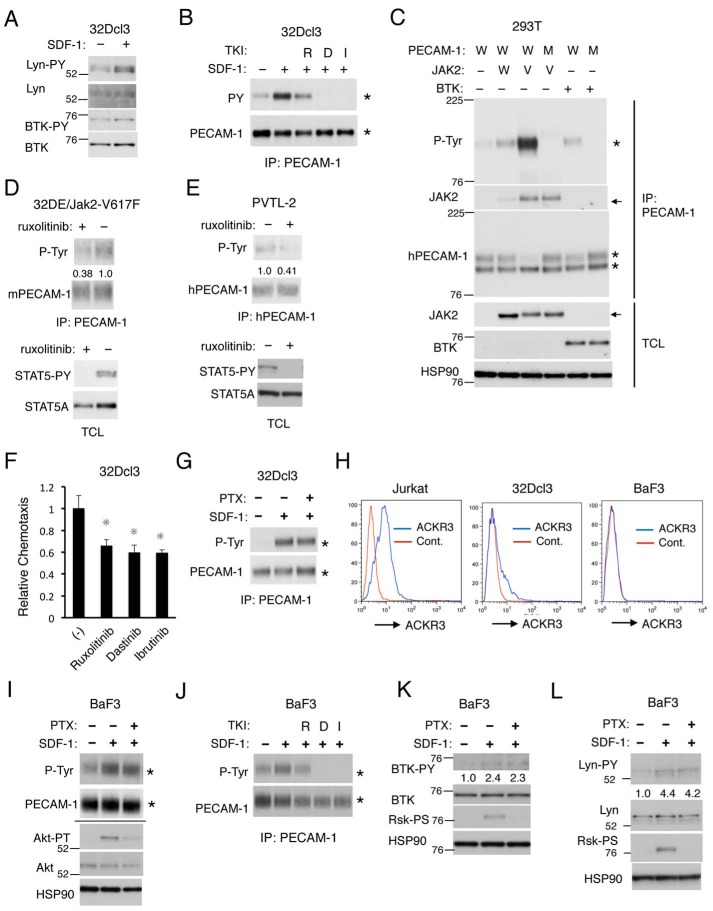
Figure 2.
SDF-1 induces tyrosine phosphorylation of PECAM-1 through Lyn, BTK, and JAK2 in a Gαi-independent manner. A, 32Dcl3 cells, starved of IL-3 for 4 h, were stimulated with 50 ng/ml SDF-1 for 1min or left unstimulated as indicated and lysed in radioimmune precipitation assay buffer. Lysates were subjected to immunoblot analysis using antibodies against the indicated proteins. Lyn-PY, phospho-Tyr396-Lyn; BTK-PY, phospho-Tyr223-BTK. B, 32Dcl3 cells, starved of IL-3 for 4 h, were left untreated or treated with 2 μm ruxolitinib (R), 20 nm dasatinib (D), or 5 μm ibrutinib (I) as indicated for 30 min. Cells were then stimulated for 1 min with 50 ng/ml SDF-1 or left unstimulated as indicated and analyzed. Positions of PECAM-1 are indicated by asterisks. C, 293T cells were transfected with plasmids coding for JAK2 wild type (W), JAK2-V617F (V), and BTK as well as PECAM-1-WT (W) or PECAM-1-Mut (M) as indicated. Anti-PECAM-1 immunoprecipitates and total cell lysates were subjected to immunoblot analysis using the indicated antibodies. HSP90 was used as a loading control. Arrows indicate positions of JAK2. Positions of molecular weight markers are also indicated. D, 32DE/JAK2-V617F cells were cultured for 6 h with or without 3 μm ruxolitinib. Cells were lysed and subjected to immunoprecipitation (IP) using antibody for PECAM-1 followed by immunoblotting with the indicated antibodies (upper panel). Total cell lysates were also subjected to immunoblot analysis with antibodies against the indicated proteins (lower panel). STAT5-PY, anti-phospho-Tyr694-STAT5. E, PVTL-2 cells were cultured with or without 2 μm ruxolitinib for 6 h (upper panel) or 1.5 μm ruxolitinib for 16 h (lower panel) and analyzed. F, 32Dcl3 cells were starved of IL-3 and cultured for 4 h in migration medium. Cells were then treated for 1 h with 1 μm ruxolitinib (R), 50 nm dasatinib (D), or 2 μm ibrutinib (I) or left untreated (−) as a control and subjected to chemotaxis assay with 100 ng/ml SDF-1. Relative chemotaxis was calculated by dividing the percentage of migrated cells pretreated with inhibitors by that of control cells. The data represent the mean of triplicates, and the asterisks indicate statistically significant (p < 0.05) differences compared with control by Student's t test. Error bars represent S.D. G, 32Dcl3 cells, starved of IL-3 for 4 h, were treated with 100 ng/ml PTX for 90 min or left untreated as indicated. Cells were then stimulated with 50 ng/ml SDF-1 for 1 min or left unstimulated as indicated and analyzed by immunoprecipitation with antibody for PECAM-1 (PECAM-1) and immunoblotting using the indicated antibodies. H, Jurkat, 32Dcl3, or BaF3 cells as indicated were starved in serum-free medium, and surface expression levels of ACKR3 were analyzed by flow cytometry. I, BaF3 cells, starved of IL-3 for 14 h, were treated with 100 ng/ml PTX for 60 min or left untreated as indicated. Cells were then stimulated with 50 ng/ml SDF-1 for 1 min or left unstimulated as indicated and analyzed. Anti-PECAM-1 immunoprecipitates and total cell lysates, shown above or below a horizontal line, respectively, were subjected to immunoblot analysis using the indicated antibodies. Akt-PT, phospho-Thr308-Akt. J, BaF3 cells, starved of IL-3 for 14 h, were left untreated or treated with 2 μm ruxolitinib (R), 20 nm dasatinib (D), or 5 μm ibrutinib (I) as indicated for 60 min. Cells were then stimulated for 1 min with 50 ng/ml SDF-1 or left unstimulated as indicated and analyzed. K, BaF3 cells, starved of IL-3 for 14 h, were treated with 100 ng/ml PTX for 60 min or left untreated as indicated. Cells were then stimulated with 50 ng/ml SDF-1 for 1 min or left unstimulated as indicated and analyzed. Relative levels of phosphorylation of BTK on Tyr223 were determined by densitometric analysis and are shown below the panel. Rsk-PS, phospho-Ser380-p90Rsk. L, BaF3 cells, starved of IL-3 for 3 h, were treated with 100 ng/ml PTX for 90 min or left untreated as indicated. Cells were then stimulated with 50 ng/ml SDF-1 for 1 min or left unstimulated as indicated and lysed in 1× Laemmli sample buffer to be analyzed. Relative levels of phosphorylation of Lyn on Tyr396 were determined by densitometric analysis and are shown below the panel. All the data shown are representative of experiments repeated at least three times with the exception of those shown in B, D, G, J, and K, which are representative of two repeated experiments. Cont., control; p-Tyr, phosphotyrosine; PY, phosphotyrosine; TKI, tyrosine kinase inhibitor; TCL, total cell lysate.

