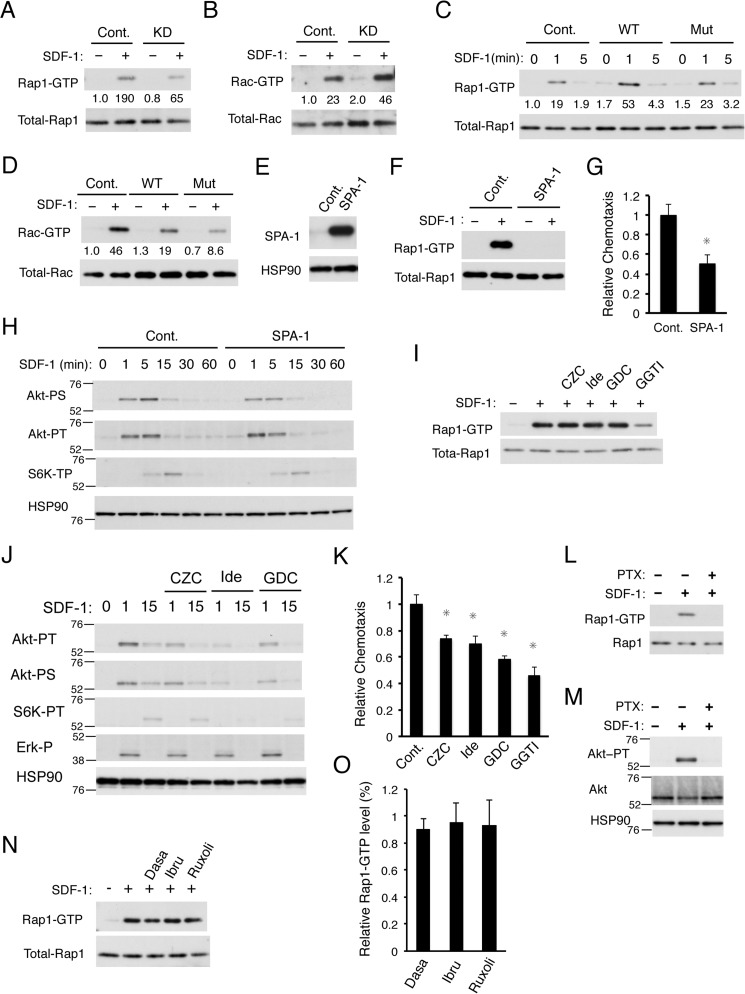
Figure 4.
PECAM-1 enhances SDF-1–induced chemotaxis also through activation of Rap1 independently of the PI3K/Akt pathway. A and B, 32Dcl3 cells expressing PECAM-1 shRNA (KD) or luciferase shRNA as a control (Cont.) were starved of IL-3 for 4 h and stimulated for 1 min with 10 ng/ml SDF-1 or left unstimulated as indicated. Cells were lysed, and Rap1-GTP or Rac-GTP was affinity-purified from cell lysates with a GST-RalGDS-RBD or GST-PAK2-RBD fusion protein. Eluates from precipitates (upper panels) or total cell lysates (lower panels) were subsequently subjected to immunoblot analysis to estimate the expression levels of activated or total amount of these small GTPases, respectively, using antibodies against Rap1 and Rac. Relative levels of Rap1-GTP and Rac-GTP were determined by densitometric analysis and are shown below the panels. C and D, 32Dcl3 cells overexpressing human PECAM-1-WT (WT) or human PECAM-1-Mut (Mut) as well as vector control cells (Cont.) were starved of IL-3 for 4 h, stimulated with 10 ng/ml SDF-1 for the indicated times, and analyzed as described for A and B. E, 32Dcl3 cells overexpressing SPA-1 and vector control cells (Cont.) were lysed and subjected to immunoblot analysis with antibodies against the indicated proteins. F, 32Dcl3 cells overexpressing SPA-1 and vector-control cells (Cont.) were starved of IL-3 for 4 h. Cells were then simulated with 10 ng/ml SDF-1 for 1 min or left unstimulated as indicated and subjected to Rap1 activation assay. G, 32Dcl3 cells overexpressing SPA-1 and vector control cells (Cont.) were subjected to chemotaxis assay with 50 ng/ml SDF-1. The data represent the mean of triplicates, and the asterisks indicate statistically significant (p < 0.05) differences compared with control. Error bars represent S.D. H, 32Dcl3 cells overexpressing SPA-1 and vector control cells (Cont.), starved of IL-3 for 6 h, were stimulated with 1 ng/ml SDF-1 for the indicated times and subjected to immunoblot analysis using antibodies against the indicated proteins. Positions of molecular weight markers are also indicated. Akt-PT, phospho-Thr308-Akt; Akt-PS, phospho-Ser473-Akt; S6K-PT, phospho-Thr389-p70S6K. I, 32Dcl3 cells, starved of IL-3 for 4 h, were treated for 90 min with 3 μm CZC24832 (CZC), 3 μm idelalisib (Ide), 3 μm GDC-0941 (GDC), or 10 μm GGTI-298 (GGTI) as indicated or left untreated as a control. Cells were stimulated with 10 ng/ml SDF-1 for 1 min or left unstimulated as indicated and analyzed for Rap1 activation. J, 32Dcl3 cells were starved of IL-3 for 12 h and treated with 3 μm CZC24832 (CZC), 3 μm idelalisib (Ide), or 3 μm GDC-0941 (GDC) as indicated for 1 h or left untreated. Cells were then stimulated with 5 ng/ml SDF-1 for the indicated times and subjected to immunoblot analysis with antibodies against the indicated proteins. Akt-PT, phospho-Thr308-Akt; Akt-PS, phospho-Ser473-Akt; S6K-PT, phospho-Thr389-p70S6K; Erk-P, phospho-Thr202/Tyr204-ERK. K, 32Dcl3 cells were starved of IL-3 and cultured for 4 h in migration medium. Cells were then treated for 1 h with 3 μm CZC24832 (CZC), 3 μm idelalisib (Ide), 3 μm GDC-0941 (GDC), or 10 μm GGTI-298 (GGTI) or left untreated (Cont.) as a control and subjected to chemotaxis assay with 100 ng/ml SDF-1. Relative chemotaxis was calculated by dividing the percentage of migrated cells for cells pretreated with inhibitors by that of control cells. Error bars represent S.D. L and M, 32Dcl3 cells, starved of IL-3 for 4 h, were treated with 100 ng/ml PTX for 90 min or left untreated as indicated. Cells were then stimulated with 50 ng/ml SDF-1 for 1 min or left unstimulated as indicated and analyzed for activation of Rap1 in L and Akt in M. N and O, 32Dcl3 cells, starved of IL-3 for 4 h, were treated for 90 min with 50 nm dasatinib (Dasa), 2 μm ibrutinib (Ibru), or 1 μm ruxolitinib (Ruxoli) as indicated or left untreated. Cells were then stimulated with 10 ng/ml SDF-1 for 1 min or left unstimulated as indicated and analyzed for Rap1 activation. A representative result from three independent experiments is shown in N. The relative Rap1-GTP level was calculated by dividing the Rap1-GTP level of cells pretreated with the inhibitor with that of control cells, and the means from three independent experiments are plotted in O. Error bars represent S.D. All the data shown are representative of experiments repeated at least three times.

