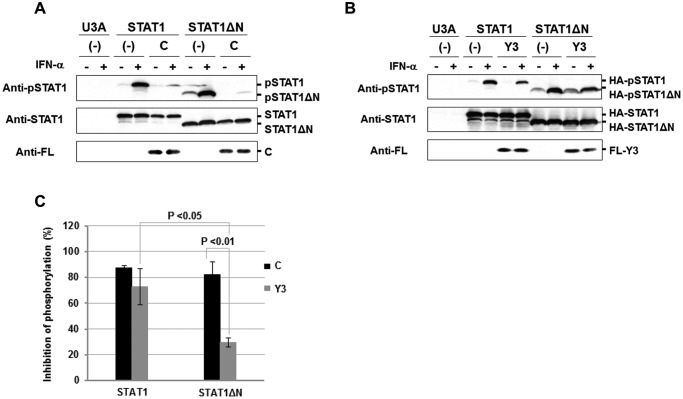
Figure 2.
Inhibition of IFN-α-induced tyrosine phosphorylation of STAT1 in the presence of C protein. U3A cells were transfected with an expression vector for HA-STAT1 or HA-STAT1ΔN together with an expression vector for FL-C (A) or FL-Y3 (B). At 0.5 h after stimulation with IFN-α (1,000 units/ml), proteins in the cell extracts were separated by SDS-PAGE for Western blot analysis with an anti-STAT1 antibody (anti-STAT1), an anti-Tyr701-phosphorylated STAT1 antibody (anti-pSTAT1) and anti-FL. C, the rate of phosphorylation inhibition was determined on the basis of averaged signal intensities of HA-pSTAT1 in the presence or absence of FL-C (A) or FL-Y3 (B), which was calculated from three independent experiments. Intensities of bands were measured using ImageJ version 1.47, and signal intensity of HA-STAT1 was used as an internal standard. An error bar indicates standard deviation. p value was calculated on the basis of Welch's test.

