Figure 5.
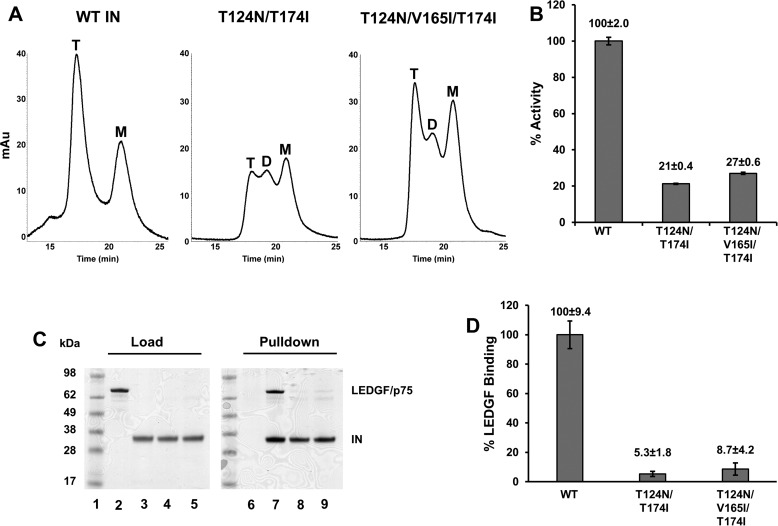
Biochemical analysis of recombinant INs. A, SEC profiles for WT, T124N/T174I, and T124N/V165I/T174I INs. The peaks corresponding to monomeric (M), dimeric (D), and tetrameric (T) forms are indicated. Shown are representative chromatograms of two independent experiments. B, catalytic activities of WT and mutant INs. The error bars indicate the S.D. of three independent experiments. C, SDS-PAGE image showing LEDGF/p75 pulldown by WT and mutant INs. Lane 1, molecular weight markers. The gel was loaded with LEDGF/p75 (lane 2), WT IN (lane 3), T124N/T174I IN (lane 4), and T124N/V165I/T174I IN (lane 5). LEDGF/p75 pulldown without IN (lane 6; negative control), WT IN (lane 7), T124N/T174I IN (lane 8), and T124N/V165I/T174I IN (lane 9) is also shown. The gel is a representative of two independent experiments. D, quantitative analysis of the experimental results shown in C. The catalytic activity and LEDGF/p75 binding values for WT IN were considered 100%, and relative values for mutant INs were determined. The error bars indicate the S.E. from two independent experiments.

