Figure 6.
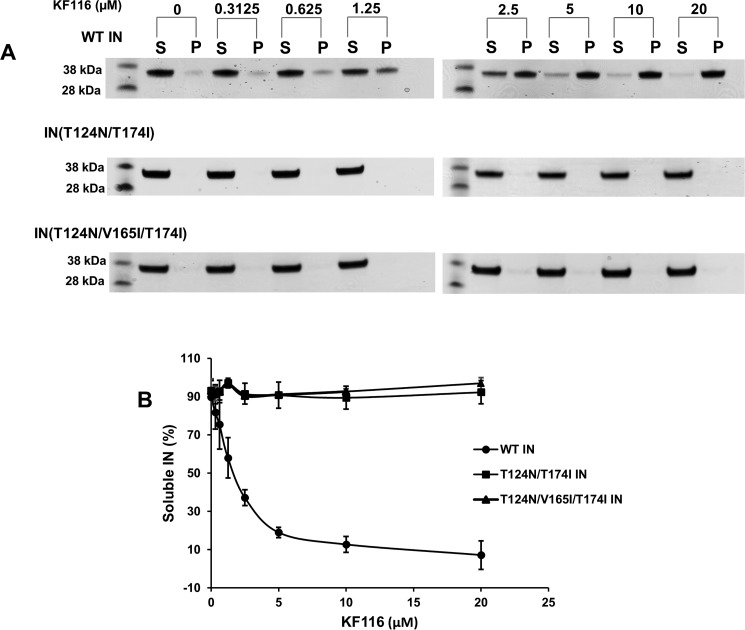
KF116-induced aggregation of IN. A, the indicated concentrations of KF116 were added to WT or mutant INs. Following centrifugation, supernatant (S) and pellet (P) fractions were analyzed by SDS-PAGE and visualized by Coomassie Blue staining. Mass standards are shown to the left. The gels are representative of two independent experiments. B, quantitative analysis of the results in A. Soluble IN fractions for DMSO controls and each indicated inhibitor concentration were determined by supernatant/(supernatant + precipitate). The error bars indicate the S.E. from two independent experiments.

