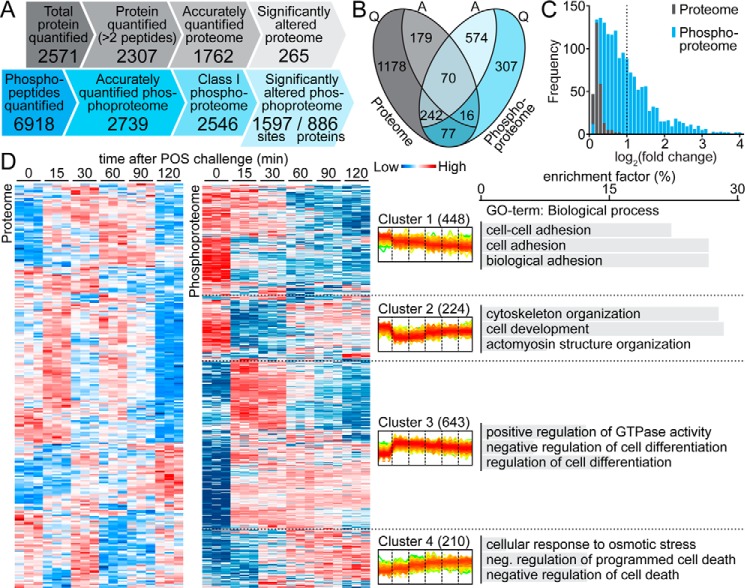
Figure 1.
Overview of the POS-stimulated ARPE-19 proteome and phosphoproteome. A, comparison of the SILAC-based quantification of ARPE-19 proteome and phosphoproteome. Only 265 of 1762 (15%) accurately quantified proteins responded to POS stimulation, whereas almost 63% of class I phosphorylation events (1597 of 2546) were significantly altered under the same conditions. B, relationships between accurately quantified (Q) and significantly altered (A) proteome (gray) and phosphoproteome (blue). C, abundance profiles of significantly altered proteome (gray) and phosphoproteome (blue). D, hierarchical clustering analysis of significantly altered proteins/phosphosites (in rows), according to their abundance profile over time (in columns). Relative abundance levels are represented with color-coded boxes (blue, low; red, high). Quantification for three biological repetitions is presented for each time point. In the center, superimposed diagrams of phosphorylation level changes over time in four clusters of phosphosites are shown. The four typical responses to POS challenge were as follows: a slow constant phosphorylation decrease (Cluster 1), a significant phosphorylation decrease followed by a slow increase (Cluster 2), a significant phosphorylation increase followed by a slow decrease (Cluster 3), and a slow constant phosphorylation increase over the experimental time period (Cluster 4). The chart on the right shows the top three enriched biological process gene ontology terms (BP-FAT) within each cluster of the POS-stimulated ARPE-19 phosphoproteome. Cluster 3 exhibited specific enrichment in the regulation of the GTPase activity biological process GO term.

