Figure 4.
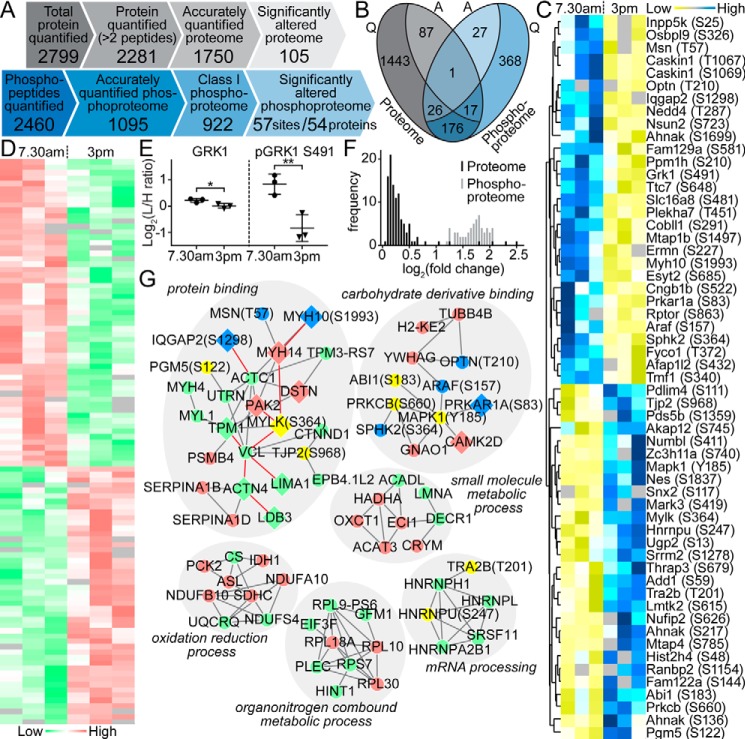
Global proteomic and phosphoproteomic analysis of native RPE. A, comparison of the quantitative proteomic and phosphoproteomic analysis of native RPE cells isolated from mouse eyes sampled in the morning (7:30 a.m.) and afternoon (3 p.m.), reflecting the highest and lowest phagocytosis intensities. B, relationships between accurately quantified (Q) and significantly altered (A) proteome (gray) and phosphoproteome (blue). One protein (GRK1) exhibited significant changes in both protein abundance and phosphorylation levels. C, heat map showing phosphorylation status of 57 phosphosites (rows) that were significantly changed between the two measurement time points (7:30 a.m. versus 3 p.m., columns). D, heat map revealing the expression level of 105 proteins (rows) significantly altered between the two measurement time points (columns). E, detailed comparison of the change in expression and phosphorylation level of GRK1 indicates a greater magnitude of oscillation in phosphorylation. F, distribution of the amplitudes of -fold changes (log2 of light/intermediate intensities) for the 105 and 57 significantly altered proteins and phosphosites, respectively. G, direct physical protein–protein interaction networks of significantly expressed RPE proteins and phosphoproteins. Relative responses to POS challenge are denoted by different colors (proteome: down-regulated (green) and up-regulated (red); phosphoproteome: down-regulated (yellow) and up-regulated (blue)).

