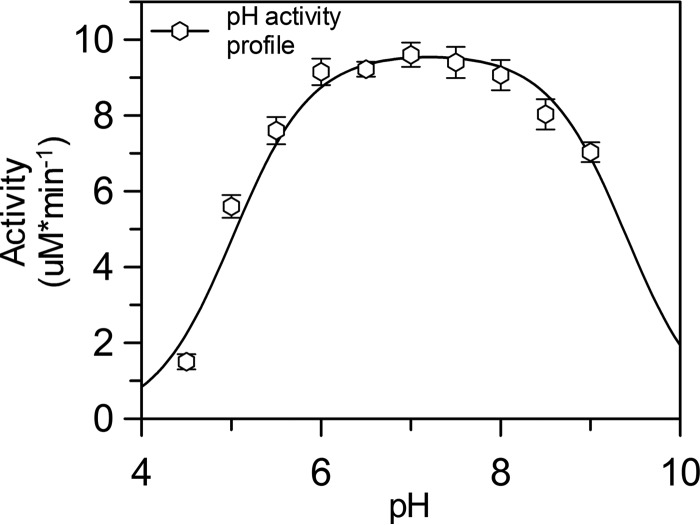
Figure 2.
pH activity profile of the FBP cleavage reaction for TgALD. Saturating concentrations of FBP were used to assay activity at pH 4–9 for every 0.5 pH unit. A double pKa curve was fitted against the kinetic data using Equation 6 (see “Experimental procedures”) in GraFit (version 6.0.12). The acidic limb of the profile has a pKa of 5.0, consistent with the pKa of a glutamate residue. Error bars, S.E. (n ≥ 3 for each point).

