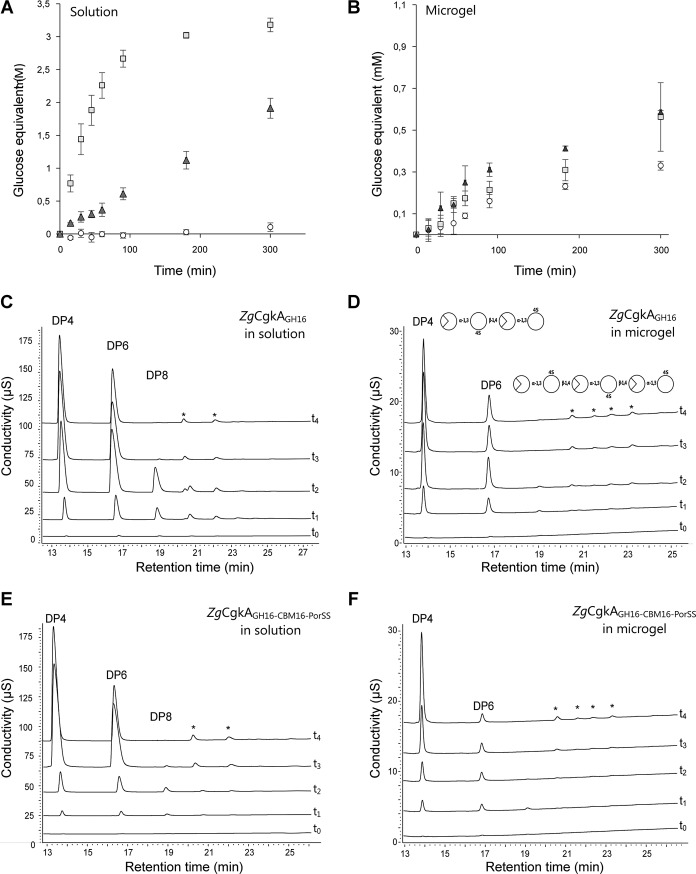
Figure 4.
Kinetics of degradation of κ-carrageenan. A and B, reducing sugar analysis in solution (A) and microgels (B) of κ-carrageenan for PcCgkAGH16 (white circles), ZgCgkAGH16 (light gray squares), and ZgCgkAGH16-CBM16-PorSS (dark gray triangles). Error bars, S.D. of triplicate determinations. C and D, HPAEC analyses of degradation products of ZgCgkAGH16 in solution (C) and in microgel (D). E and F, HPAEC analyses of degradation products of ZgCgkAGH16-CBM16-PorSS in solution (E) and in microgel (F). For C, D, E, and F, different curves correspond to kinetics at t0 = 0, t1 = 15 min, t2 = 45 min, t3 = 24 h, t4 = 1 week. The asterisks in C–F designate peaks corresponding to noncharacterized reaction products.

