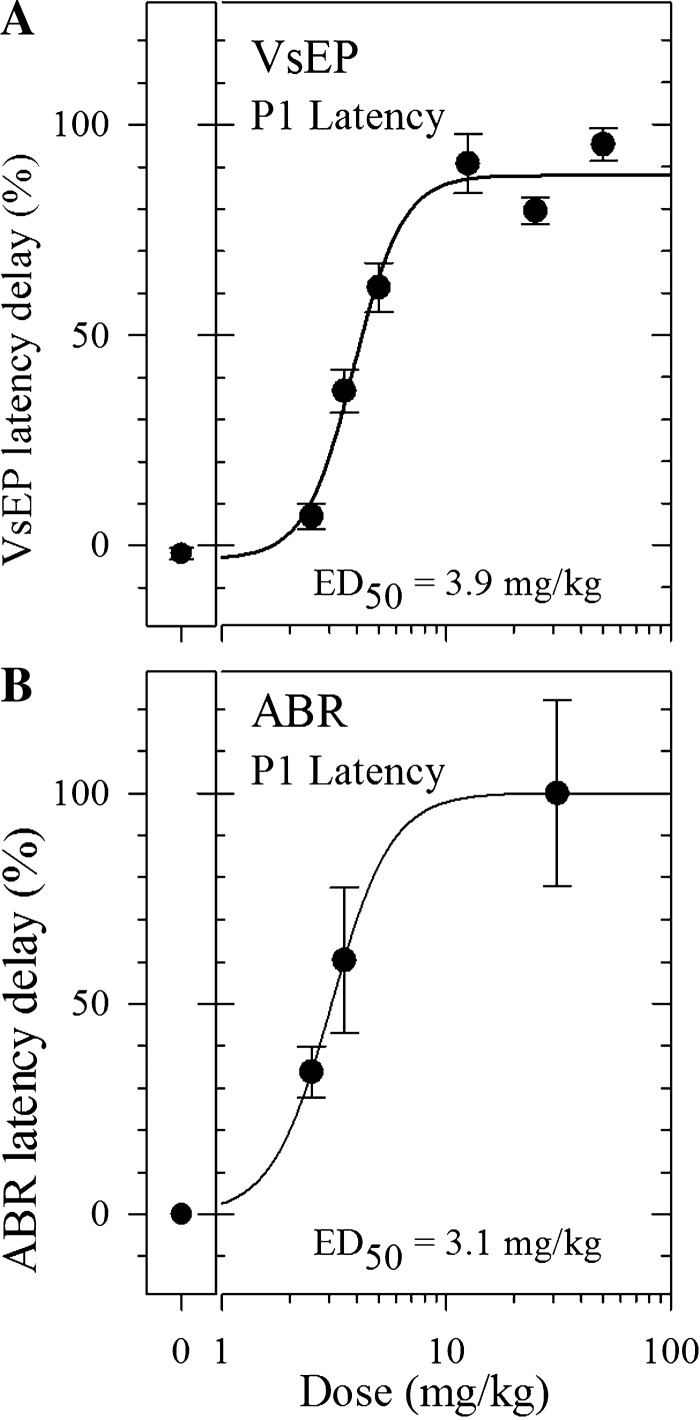
Fig. 4.
A: XE991 dose-response curves for VsEP latencies (P1) during vestibular response suppression. Normalized P1 latency delays (mean maximum delay for each dose minus the mean baseline value for each dose) are plotted as the percentage of the maximum delay across all doses as a function of dose for 2.5 mg/kg and higher. The XE991 50% effective dose (ED50) for VsEP was 3.9 mg/kg (Hill slope = 3.9% per mg/kg). The largest drug effect occurred in the highest dose group, and the mean latency delay value for this group was defined as the maximum delay for the drug. This was used to calculate the %maximum delay for each of the respective dose groups. Values for each dose are based on mean latency delay observed during the steady-state period of maximal effect following injection; 0% represents the %maximum delay observed for the saline group. Mean %maximum delay (±SE) is represented for each dose. B: XE991 dose-response curves for ABR latencies (P1) during response suppression. Normalized ABR P1 latencies were significantly delayed by XE991 administration at doses of 2.5 mg/kg and higher. The largest drug effect occurred in the highest dose group. For the highest ABR dose group, the average dose of 50 and 12.5 mg/kg [(50 + 12.5)/2 = 31.25 mg/kg] was adopted and used for graphic display, and the mean latency delay for this group was used for calculation of %maximum delay. Calculations were made using the same strategy outlined in A. Mean %maximum delay(±SE) is represented for each dose. XE991 ED50 for ABR was 3.1 mg/kg (Hill slope = 3.2% per mg/kg).

