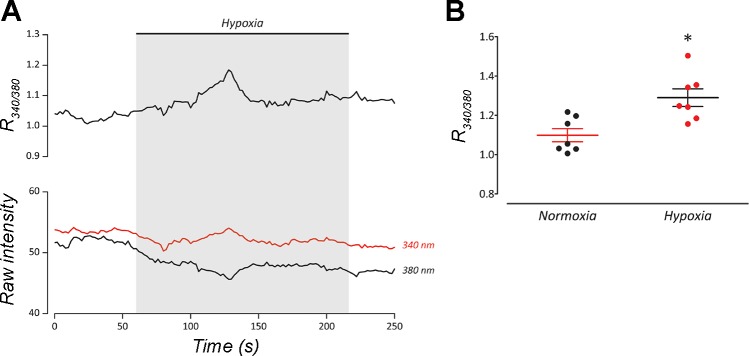
Fig. 7.
Intracellular Ca2+ increased in response to hypoxia in isolated neuroepithelial cells (NECs) of goldfish. A: representative recording of a NEC responding to hypoxia by increasing intracellular Ca2+ concentration ([Ca2+]i). Upper trace shows 340/380-nm excitation ratio (R340/380) using fura-2 AM; bottom traces show raw intensities at each wavelength. B: Plot of means ± SE R340/380 indicates that [Ca2+]i rose significantly during hypoxia compared with normoxia (*P < 0.01, Wilcoxon matched-pairs test; n = 7).

