Figure 2.
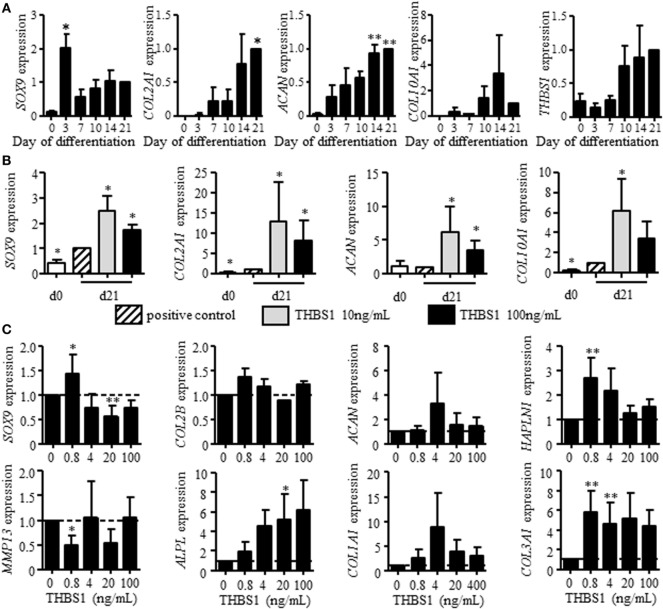
Effect of recombinant thrombospondin-1 (THBS1) on chondrogenesis and osteoarthritic chondrocyte phenotype. (A) Relative expression of markers specific for chondrocytes [SOX9, collagen type II variant B (COL2A1), aggrecan (ACAN), collagen type X (COL10A1)] or THBS1 at different time points during differentiation of mesenchymal stem cells (MSCs) into chondrocytes or (B) after treatment with 10 or 100 ng/mL of THBS1 from days 14 to 21 of differentiation. Results are normalized to gene expression level in positive control (TGFβ3-induced differentiation of MSC) at day 21 and represented as mean ± SEM of four biological replicates. (C) Markers of mature chondrocytes (SOX9, COL2A1 variant B, ACAN, and HAPLN1), hypertrophic chondrocytes (MMP13, ALPL), and fibrocartilage (COL1A1, COL3A1) were quantified in osteoarthritic chondrocytes treated with different concentrations of recombinant THBS1 (rTHBS1) (n = 5 biological replicates). Results are expressed as fold change of gene expression compared to untreated chondrocytes and represented as mean ± SEM. Statistics used Mann–Whitney test: *p ≤ 0.05, **p ≤ 0.01.

