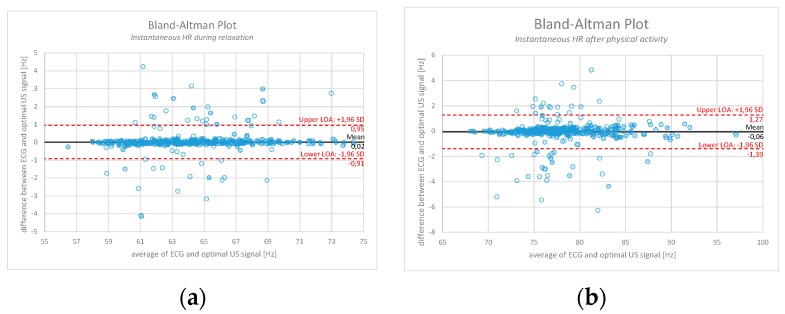
Figure 13.
Bland-Altman plot comparison between the calculated instantaneous HR obtained from the ground truth ECG and the optimal US signal (where known unwanted artefacts have already been filtered out). (a) represents an example measurement during relaxation period (95.6% of the signal lies within the LOA); (b) represents an example measurement after physical activity (94.9% of the signal lies within the LOA).

