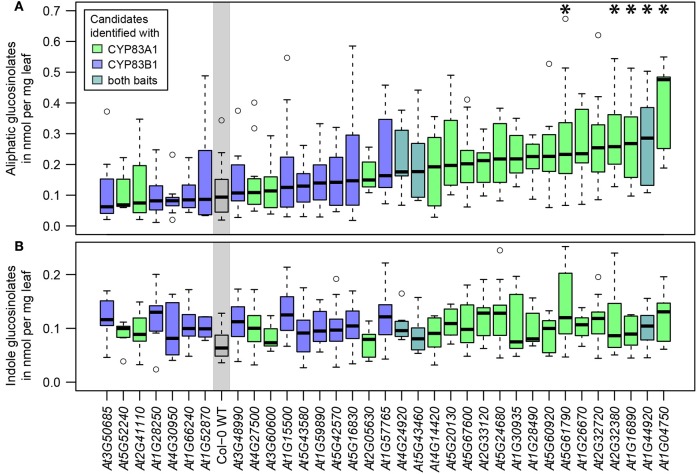
Figure 3.
Glucosinolate analysis of plants carrying mutant alleles of identified genes. (A) Total aliphatic glucosinolate levels. (B) Total indole glucosinolate levels. The genes of candidate interactors are sorted and plotted according to their median aliphatic glucosinolate content and the plot is color coded according to the baits with which the proteins were identified. Glucosinolate levels significantly deviating from wildtype (WT) levels are marked with * [Two-way ANOVA (Table S4) followed by post-hoc t-test, Holm-adjustment for multiple testing, p < 0.05, n = 6–12, Col-0 WT: n = 22].

