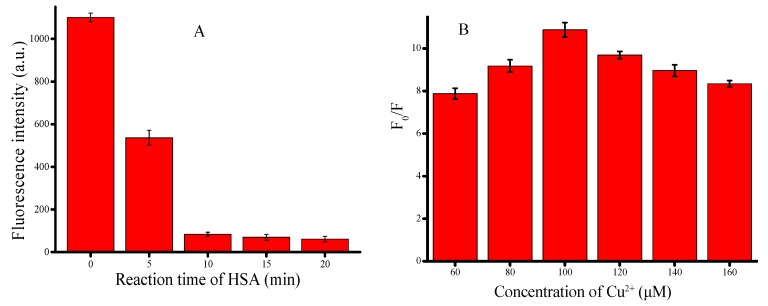
Figure 2.
Optimization of experimental conditions. (A) Changes in fluorescence intensity with reaction time of HSA (0, 5, 10, 15, 20 min); (B) Changes in fluorescence intensity with different concentrations of CuSO4 (60, 80, 100, 120, 140, 160 μM). Error bars were estimated from three replicate measurements.

