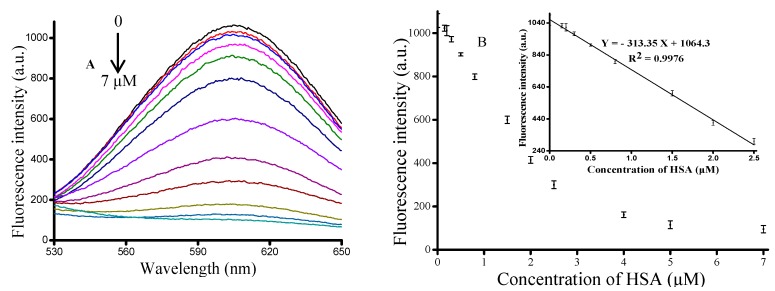
Figure 3.
(A) Fluorescence emission spectra of the concentration of HSA (0, 0.15, 0.2, 0.3, 0.5, 0.8, 1.5, 2, 2.5, 4, 7 μM). Optimized assay conditions were used; (B) Graph depicting the changes in fluorescence output at 610 nm as a function of HSA concentration. Inset: Linear relationship between fluorescence intensity and low HSA concentrations. Error bars were estimated from three replicate measurements.

