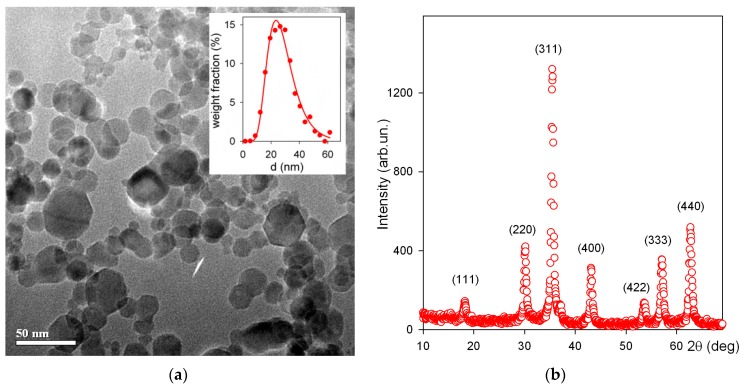
Figure 2.
TEM image of iron oxide MNPs (JEOL JEM2100 operating at 200 kV). Inset: particle size distribution (number averaged) obtained by the graphical analysis of TEM images (2160 particles) (a). XRD plot for iron oxide MNPs (Bruker D8 DISCOVER) Cu-Kα radiation (λ = 1.5418 Å), a graphite monochromator and a scintillation detector (b).

