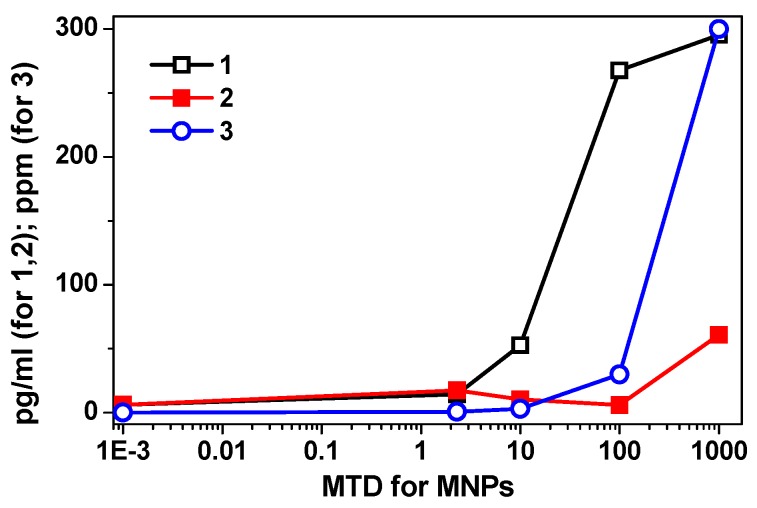
Figure 6.
An example of modulating effect of suspensions on cytokine (here, IL-10), concentrations are given for 24-h HBMLs culture. Curve 1 corresponds to the FF1 suspension without chitosan, curve 2 corresponds to the FF2 suspension with chitosan and curve 3 shows correlation between calculated dependence of iron concentration in MTDs in ppm.

