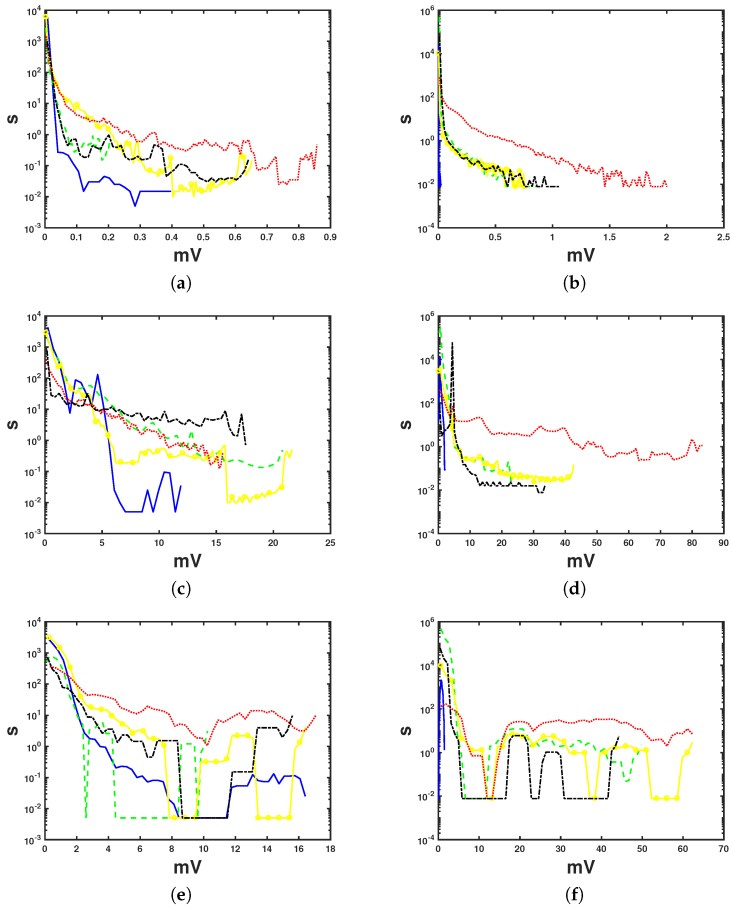
Figure 3.
Estimated distributions (from scaled log-histograms) for the different noise types in external event recorder (EER) (a,c,e) and 7 day Holter (b,d,f) recordings. Noise samples (in duration, seconds, as multiplied times the sampling period) are represented in terms of the noise with the same voltage level (in mV). The color code is similar to that for the noise maps: noise-free segments—blue; low-noise—dashed, green; moderate-noise—crosses, yellow; hard-noise—dotted, red; and other noises—dash–dot, black. Axis represent number of samples scaled to their time duration (vertical, in s) vs. amplitude (horizontal, in mV).

