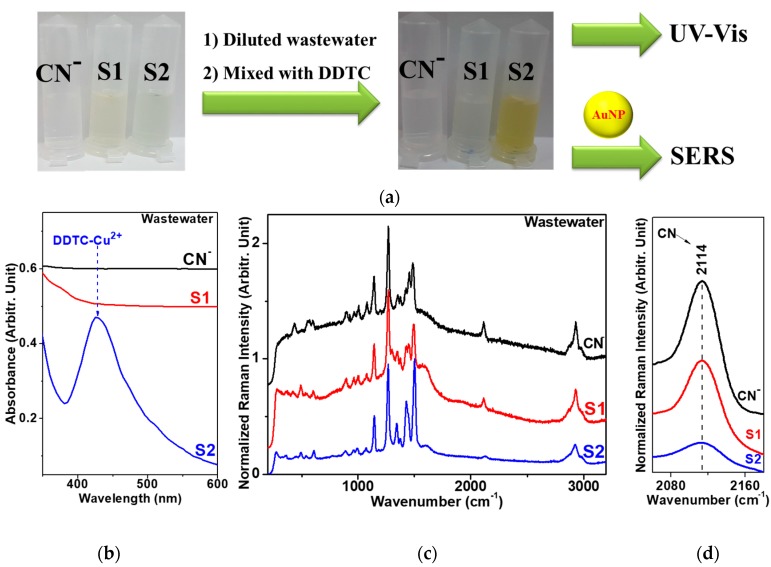
Figure 4.
(a) Initial photo of the industrial wastewater samples: [CN] = 100 ppm, “S1” (cyanide-containing), and “S2” (after alkaline chlorination). Photo of wastewater samples after dilution and treatment with DDTC. (b) UV-Vis absorption spectra of [CN], “S1”, and “S2” after treatment with DDTC. (c) SERS spectra of [CN], “S1”, and “S2” on AuNPs after treatment with DDTC. (d) A magnified view of the C≡N triple bond stretching region at ~2114 cm−1.

