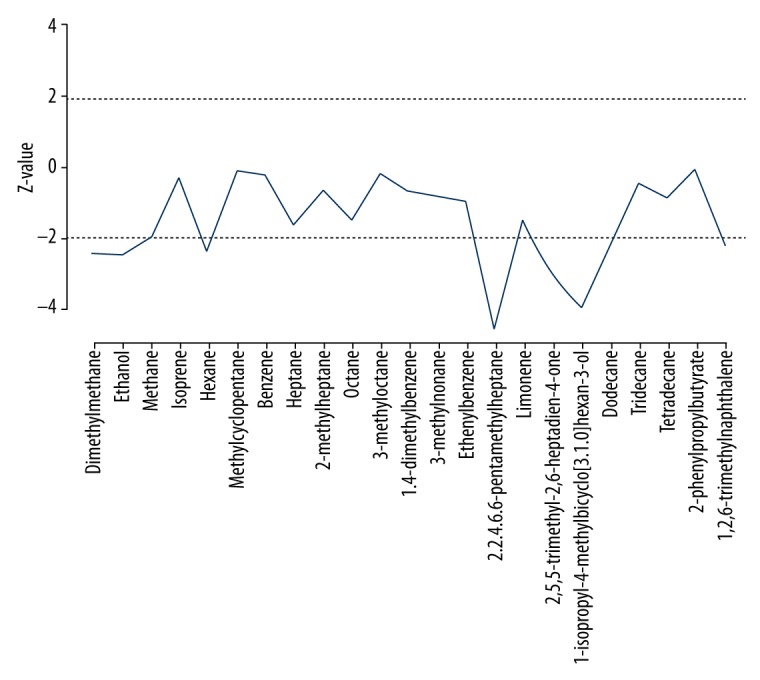
Figure 4.

Non-parametric Mann-Whitney U test comparing Z values of 23 VOCs in the lung cancer and healthy control groups. Dashed line: significance of Z=±1.96. The VOCs (dimethylmethane [Z=−2.426, P=0.015], ethanol [Z=−2.470, P=0.014], methane [Z=−1.989, P=0.047], hexane [Z=−2.321, P=0.020], 2.2.4.6.6-pentamethylheptane [Z=−4.543, P=0.001], 2,5,5-trimethyl-2,6-heptadien-4-one [Z=−2.926, P=0.003], 1-isopropyl-4-methylbicyclo [3.1.0] hexan-3-ol [Z=−3.904, P=0.001], dodecane [Z=−2.137, P=0.033], and 1,2,6-trimethylnaphthalen [Z=−2.241, P=0.025]). Z values that exceed the dashed line significantly differ between the lung cancer and healthy control groups.
